

NEW international Cabin AIR Index launched
Fleet owners, policy makers and drivers now have access to independent, standardised vehicle ventilation ratings
Fleet owners, policy makers and drivers now have access to independent, standardised vehicle ventilation ratings
Easy to understand and comparable ratings provide clarity for drivers and car buyers.
The first independent data set enabling policy makers to protect vehicle occupants.
The independent Cabin AIR Index rates the ability of each filter and ventilation system to protect vehicle occupants from exterior pollution.
The A-E colour-coded rating is endorsed by global air quality and vehicle emissions experts.
Moe information available at www.airindex.com/emissions-ratings/cabin-air-quality-in-cars/
25 July 2023: Today’s launch of the Cabin AIR Index reveals, for the first time using scientific data, the effectiveness of vehicle ventilation systems and the choice of filters in reducing the exposure of vehicle occupants to harmful pollutants.
Developed from more than five years of independent, international research the new Cabin AIR Index ratings reveal accurately how much pollution enters a vehicle compared to the outside air, when it is used in towns and cities.
Exposure to high levels of pollutants in the air can cause a range of serious health issues including respiratory problems, heart disease, strokes and lung cancer¹.
The air quality inside cars and vans (M1 and N1 categories²) is unregulated, leaving drivers and passengers unaware of the levels of exposure to damaging pollutants. In Europe alone, air pollution is estimated to cause more than 300,000 premature deaths each year³.
The Cabin AIR Index has been created to inform and empower drivers, passengers, fleet owners and policy makers with the real facts about the protection offered by the ventilation systems and filters in the cars they use and travel in. A simple A-E colour-coded rating, based on a new real-world standard, shows the difference in effectiveness in filtering harmful pollutants.
In 2021 more than 97% of the urban population was exposed to concentrations of fine particulate matter above the health-based guideline level set by the World Health Organization⁴. Drivers and passengers, and in particular professional drivers who are in vehicles for several hours each day are now able to compare vehicles and the filter systems, enabling choice, for the first time based on scientific data.
Today’s launch of the Cabin AIR Index also reveals the significant variation in protection offered by the same vehicle, depending on the type of interior air filter used. When tested on the same car, the combination of ventilation system and one filter was only able to reduce the level of exposure to outside particles for drivers and passengers by 30% during the course of the test, whilst the best performing combination of system and filter achieved 82%.
The Cabin AIR Index ratings show ‘at a glance’ how effective the vehicle ventilation system is, allowing comparison with other vehicles, and other filters installed based on scientifically robust, repeatable, on-road vehicle testing according to the new CWA 17934 methodology.
Massimo Fedeli, Co-founder and Operations Director of the AIR Alliance said: “The health effects of breathing fine particulate matter in urban air are now, sadly, well established and estimated to cause more than 300,000 premature deaths in Europe each year. Drivers and passengers in urban areas may assume that closing windows and using the ventilation system prevents exposure to particulate matter, but that is not necessarily the case.
“Following five years of research, today the AIR Alliance is launching the Cabin AIR Index which rates the ability of the ventilation system to filter the number of particles from outside the vehicle and presents the results in a simple A-E colour coded scale.
“The Cabin AIR Index is the first opportunity for drivers and passengers to see the protection offered by vehicle ventilation systems, and also reveals the difference in performance between different filters fitted to the same vehicle, enabling drivers to make a choice when selecting the filter for their car or van.”
Nick Molden, Co-founder of the AIR Alliance said: “The Cabin AIR Index is based on data collected according to the CWA 17934 methodology, the independent, scientifically robust methodology to collect real drive vehicle interior air quality data. In the absence of any regulations for air quality inside cars and vans, drivers and passengers are unaware of the levels of pollution, and in particular the number of particles which enter the cabin.
“Drivers, and especially professional drivers who are in the vehicle for several hours each day, should be aware that the choice of interior air filter can make a significant difference to the quality of air that they breathe. Our tests show that the same ventilation system fitted with different, but compatible filters, reduced the level of exposure to outside particles for drivers and passengers between 30% and 82%.
“We have worked hard over the last three years with our independent, expert academic and industry group to define standardisation of data collection through the CEN Workshop Agreement 17934. We rate data collected by this method on the Cabin AIR Index providing comparative information between vehicles using fair testing criteria, all conducted on-road in real driving conditions. The same standardised test is applied to each different car type.
“For the first time policy makers and fleet owners have the ability to protect vehicle occupants, using the Cabin AIR Index to define the minimum standards expected to protect occupants.”
The results of the seven filters tested for the AIR Alliance on a 2018 Nissan Qashqai and rated in the Cabin AIR Index are:

*Cabin Air Quality Index (CAQI) as defined in the CWA Workshop Agreement 17934
**the age, make and part number of the interior filter which was pre-installed in the test vehicle was unknown.
The AIR Alliance has now commissioned a programme of vehicle and filter testing and more results will be added to the Cabin AIR Index periodically.
About the Cabin AIR Index
Vehicle ventilation systems for cars and vans (M1 and N1 categories2) rated for the Cabin AIR Index are tested according to the CWA 17934 standardised methodology which ensures that the results are independent, repeatable and comparable.
The testing is carried out on a vehicle, sourced independently from vehicle manufacturers, with Pollution In-cabin Emissions Measurement Systems (PIMS) equipment recording the air quality inside and outside the vehicle during on-road driving in towns and cities.
For a result to be considered acceptable for rating in the Cabin AIR Index at least three sperate tests must be conducted on each model, within specific boundary conditions⁵ at an average speed between 30 km/h and 50 km/h, with each test lasting at least 30 minutes.
Testing is conducted with the ventilation system in ‘fresh air’ mode, the air conditioning turned off, and temperature set to 19°C in either automatic mode, or 50% fan speed if manual, and the vents facing forward and level.
The results of the tests provide the basis to rate the vehicle ventilation systems according to the A-E, colour-coded scale.

Cabin AIR Index ratings
The AIR Index website reports the first tests conducted on a single vehicle with different filters showing Cabin AIR Index ratings A-E. Car buyers and fleet operators should consider carefully the implication for the health of vehicle occupants when selecting the vehicle and choice of filter to minimise the ingress of harmful particles.
Background to the Cabin AIR Index testing process
Emissions Analytics, founded by Nick Molden (Co-founder of the AIR Alliance), was a pioneer in methodologies to test on-road tailpipe emissions using Portable Emissions Measurement Systems (PEMS) equipment. Since 2018 Emissions Analytics has also independently tested the air quality inside vehicles using Pollution In-cabin Emissions Measurement Systems (PIMS) equipment, and the insight gained from more than 100 tests conducted by Emissions Analytics informed the development of the CEN Workshop agreement which led to the CWA 17934 methodology from which the Cabin AIR Index has been created.
For more information see https://www.emissionsanalytics.com/vehicle-interior-air-quality.
¹ World Health Organization https://www.who.int/news-room/fact-sheets/detail/ambient-(outdoor)-air-quality-and-health
² Vehicle Approval categories https://www.gov.uk/vehicle-approval/individual-vehicle-approval-manuals
³ Air quality impacts in Europe European Environment Agency https://www.eea.europa.eu/publications/air-quality-in-europe-2021
⁴ Europe’s air quality status 2023 https://www.eea.europa.eu/publications/europes-air-quality-status-2023
⁵ More details about CWA 17934 and the boundary conditions are available at the CEN website https://standards.cencenelec.eu/dyn/www/f?p=CEN:110:0::::FSP_PROJECT,FSP_ORG_ID:76650,2654151&cs=1A37B6A2248CB063033111B9F708BAB58

Open letter: Regulating pollutants from tyre emissions
An important and groundbreaking part of the proposed Euro 7 regulation involves setting a limit value for tyre wear emissions. This is particularly important as vehicles continue to become heavier, not least with the growing sales of battery electric vehicles.
To whom it may concern:
An important and groundbreaking part of the proposed Euro 7 regulation involves setting a limit value for tyre wear emissions. This is particularly important as vehicles continue to become heavier, not least with the growing sales of battery electric vehicles. However, the current proposal covers only the total mass of emissions and, therefore, ignores both ultrafine nanoparticles and chemicals released from the tyres. Without changes, it is likely that tyres will be re-engineered to deliver lower emissions of larger particles but potentially at the cost of the release of more invisible nanoparticles and potentially toxic chemicals.
Therefore, we would call on the European regulators to initiate work as soon as possible on a second phase to Euro 7 tyre emissions that would expand the coverage to both nanoparticles and chemical release in real-world conditions.
Regulating mass, and thereby larger particles, is important particularly for marine pollution, as the over 50% reduction in the population of coho salmon on the west coast of North America shows. This die-off has been conclusively linked by academics to a preservative compound found primarily in tyres. By this very fact, it can be seen that it is not only the particles themselves that is causing the issue, but the chemicals leaching out as those particles settle in the environment. Furthermore, these same tyre chemicals are being seen on a widespread basis in human foodstuffs and excreta.
These chemicals are typically volatile organic compounds. Within this broad collection there is group of aromatic compounds, many of which are carcinogenic, such as polycyclic aromatic hydrocarbons (PAHs). To some extent these are regulated at the tailpipe currently through the total hydrocarbons limit value, although this could also be made more stringent and targeted to the most potentially toxic individual compounds. Eight compounds are also restricted under the REACH chemical regulation, but the coverage is too narrow and the limits too accommodating. Emissions Analytics presented on this topic at the fifth session of the UNECE Task Force on Tyre Abrasion on 30 September 2022¹. There is regulatory precedent from Switzerland, where the 2014 particle number standard (SN 277206:2014) included a secondary emissions test for certain target chemicals—including PAHs and nitro-aromatics—based on the US Clean Air Act section 202².
Nanoparticles are already regulated at the tailpipe since Euro 5. This intervention has been highly successful in reducing in-use emissions by particle filters in most vehicles, and measurement of these ultrafine particles is being expanded into the periodic technical inspection regimes in a number of European countries, which in all likely will deliver further significant reductions in real-world particle emissions. As the evidence for the negative health outcomes from chronic and acute exposure to nanoparticles becomes ever clearer, the value of this regulation grows. Yet, there are no current plans to regulate the same particles from tyres, despite tyres being made of the same underlying fossil materials as liquid fuels. Multiple academic studies have shown that tyres release large numbers of these particles in real-world use. Particle number measurement from tyres has been included for many years in the investigations of the Joint Research Centre of the European Community and the Particle Measurement Programme³, and such efforts should be accelerated to address this growing environmental issue.
In summary, we call on European regulators to apply the same approach they have applied to the tailpipe to the growing issue of tyre emissions. Particle mass, particle number and volatile organic compounds released from tyres must all come within a successful Euro 7 regulation at the earliest opportunity.
Signatories:
Nick Molden, Chief Executive Officer, Emissions Analytics
Dr Andreas Mayer, Chairman of the Scientific Committee, VERT Association
Footnotes:
Source: Nick Molden | Dr Andreas Mayer
Posted 27 June 2023 on Dieselnet
AIR welcomes the publication of a standardised method to collect vehicle interior air quality data
The AIR Alliance (Allow Independent Road-testing), the independent alliance set up to improve air quality by promoting independent, on-road vehicle emissions testing, welcomes the publication of the CEN workshop agreement CWA 17934, the real drive test method for collecting vehicle interior air quality data.
Emissions Analytics was pleased to support the AIR Alliance with testing to validate this new standardised method for measuring vehicle interior air quality, so it can help reduce the exposures to pollution for drivers and passengers.

Euro 8: Rethinking Vehicle Emissions Fundamentally
Just as European regulators are consumed by finalising the touted 'Euro 7' regulation, it is perhaps the right time to consider the longer-term trajectory for vehicle regulation. There is a tension in the narrative around Euro 7.
Just as European regulators are consumed by finalising the touted 'Euro 7' regulation, it is perhaps the right time to consider the longer-term trajectory for vehicle regulation. There is a tension in the narrative around Euro 7. At points it has been talked about as the “final” set of emissions regulations, but now the message is being put out that the intention is not to “kill” the internal combustion engine (ICE). Unless foreshadowing the end of the ICE, it would be bold and presumptuous to call Euro 7 the final regulation.
In reality, Euro 7 is unlikely to be the final regulation, not because of the end of ICEs, but because vehicles of all types, including battery electric vehicles (BEVs) emit lots of substances from sources other than the exhaust. This newsletter set out those additional sources, and what shape a subsequent Euro 8 regulation might conceptually take. This is consistent with Emissions Analytics’ mission to establish the true, real-world environmental impact of vehicles. BEVs, it should be kept in mind, exist only for their greenhouse gas reduction potential, not for meeting air quality laws, as the regulated pollutant emissions out of the current generation of ICEs are low.

Why are BEVs not required to meet air quality laws in Europe? Since the introduction of the Real Driving Emissions (RDE) on-road validation of certification values introduced mid-way through Euro 6,gaseous tailpipe pollutant levels are now confirmed as low in average driving. For some, they were low even before RDE. The average nitrogen oxide (NOx) emissions from RDE diesel vehicles are 45mg/km and falling, compared to the regulatory limit of 80mg/km. Mean carbon monoxide from RDE gasoline vehicles is 157mg/km compared to the limit of 500mg/km. Total hydrocarbons (THC) from RDE gasoline vehicles are now typically below 10mg/km compared to the limit of 100mg/km. Particle mass emissions are now very close to zero on current diesel and direct injection gasoline vehicles, with a limit of 4.5mg/km on the PMP procedure.
Of the regulated pollutants, therefore, all seem well controlled, except for ultrafine particle emissions – measured through the particle number (PN) standard – and potentially particles more generally from port fuel injection gasoline cars. The widening of the size range of particles measured, down to 10nm, likely to be proposed in Euro 7, will offer a valuable tightening of this part of the regulatory regime.
For the Euro regulations themselves, greenhouse gases are not regulated – except indirectly for methane (CH4) through THC – as the fleet average carbon dioxide (CO²) targets act separately. Whether promoting BEVs is the optimal way to achieve these targets was the subject of a previous newsletter: www.emissionsanalytics.com/news/hybrids-are-better. Relevant here is the potential addition of methane and nitrous oxide (N2O) under Euro 7, even though they are primarily greenhouse gases rather than air quality pollutants. They are both more potent greenhouse gases than CO², although survive for a shorter time in the atmosphere: 28 and 265 times higher potency respectively on a hundred-year time horizon1. Therefore, only small amounts of N2O emissions could nullify much of the hard-won CO² reduction.
So, on the surface of it, Euro 7 could be the last regulation for pollutant emissions, while greenhouse gases are actively addressed through the CO² targets. What may be neglected, however, is volatile organic compounds (VOCs) from the exhaust. These compounds are numerous, small in volume but potentially highly toxic in their human health effects. Therefore, their current regulation in the laboratory as non-methane hydrocarbons (NMHC) may be insufficient: not only that the limit is high at 68mg/km, but also that it does not apply to diesel vehicles. Furthermore, by only considering the total, there is no visibility on whether that total is made up of toxic or innocuous compounds.
The University of York in the UK has been at the forefront of studying this area, highlighting particularly the role of these compounds in the atmospheric chemistry that leads to ground-level ozone and secondary organic aerosol particle formation². Therefore, these compounds do not just have direct effects on human health, but indirectly lead to poor air quality. While oxidation catalysts in the exhaust of gasoline vehicles may be highly effective in converting VOCs, their effectiveness against the heavier, semi-volatile organic compounds (SVOCs) such as the carcinogenic polycyclic aromatic hydrocarbons (PAHs) is less clear. Generally, also, these ICE vehicles suffer from relatively high VOC and SVOC emissions when the engine is cold.
From this, we can conclude that Euro 7 perhaps should not be the final regulatory stage, so long as ICEs are still sold, which is likely to be through to at least 2035 in Europe. While Euro 7 is looking at regulating a small number of highly volatile compounds such as formaldehyde, the broader spectrum of organic compounds is not currently being actively considered. This is important when you put it in the broader picture of the environmental impact of vehicles. Specifically, there are instructive parallels with the emissions from tyres and from materials inside the vehicle cabin – both of which are very lightly regulated currently. Tyres will be a topic of a later newsletter, so here we will focus on the vehicle interior.
In our last newsletter (From performance to experience), we reviewed the evidence for concentrations of particles and CO² in the cabin during on-road driving. It concluded that the quality of air inside the cabin is highly dependent on the quality of the ventilation system and its filter. For some vehicles, in-cabin particle concentrations were many times higher than outside on average, and the use of the recirculation mode led to steep rises in CO² concentrations to the point of potentially having cognitive effects on the driver.
But that is not everything. The single biggest complaint from new car buyers in China is about the ‘new car smell’, which is caused by a mix of VOCs. These VOCs may have health effects that go well beyond simply causing malodours. The source of the new car smell is VOCs being released from interior materials and glues used to put the vehicle together. Sources of VOCs go beyond that too, including those that enter the cabin from outside (which in turn come from other vehicles, home heating, industrial sources and so on), fuel evaporating from the tank and emissions from the body and clothing of human occupants. What is important is to be able to differentiate the toxic from the harmless VOCs – the toxic ones being more likely to come from combustion of fossil fuels or materials derived from fossil fuels, such as plastics and adhesives.
To study this, Emissions Analytics has recently opened a testing laboratory with two-dimensional gas chromatography and time-of-flight mass spectrometry from Markes International and Sepsolve. This allows us to test for tailpipe and in-cabin VOCs with excellent separation, identification and quantification. Taking one of the early car tests, a sample of air was taken and 617 different compounds were identified, with 25 being particularly being abundant. These compounds can be illustrated on a two-dimensional chromatogram, as shown below. The horizontal dimensions are the two axes of separation and each peak represents one compound, with the area under the peak broadly reflecting the amount present.

Looking in more detail at the most abundant compounds, it is possible to relate each to the risks to human health, as shown in the table below, with a colour classification reflecting the toxicity.

In addition to these, formaldehyde was identified through a separate process using high-performance liquid chromatography. Formaldehyde is another respiratory irritant and a contributory factor in asthma and some cancers.
The vehicle was a recent model year mid-range European gasoline passenger car. These effects are a combination of irritants that would lead to various degrees of discomfort while in the vehicle. A longer time spent in the car would correlate with a greater health or comfort effect. The 617 compounds identified can be put into the following generic groups, corresponding to the coloured areas on the chromatogram for ease of interpretation (with the axes being the two dimensions of separation and the colour corresponding to the intensity of the peak). These groupings give an area percentage which can be used for the characterisation of compounds. This is a simple interpretation, while more detailed analysis can quantify the amount of each compound.

Therefore, this vehicle contained a large number of compounds that are respiratory irritants and cause organ damage, together with a material number of carcinogens.
China is planning to regulate eight targeted compounds in the vehicle interior, although the timetable for implementation has slipped. Emissions Analytics identified six of the eight target compounds in its test, particularly formaldehyde and toluene. Moderate concentrations of benzene and ethylbenzene were present, with lower amounts of acetaldehyde and styrene. Japan, Korea and Russia also regulate similarly limited repertoires of these VOCs.
The main control in Europe for these VOCs is through the ‘REACH’³ restrictions on substances that can be use in product manufacturing. Currently only eight PAH compounds are restricted – according to their concentration in the final product – primarily as carcinogens: benzo(a)pyrene, benzo(e)pyrene, benzo(a)anthracene, chrysene, benzo(b)fluoranthene, benzo(j)fluoranthene, benzo(k)fluoranthene and dibenzo(a,h)anthracene. These restrictions apply to products including tyres and plastic components than come in contact with the human skin, including some parts of the vehicle interior.

The most progressive approach to measuring vehicle interior VOCs, focusing on materials, is the Vehicle Interior Air Quality group at the UNECE. In 2020, it finalised a revision to Mutual Resolution 3 that standardises measurement of these compounds and offers a platform for future regulation by national governments. Substances tested under this protocol are VOCs ranging in volatility from n-C⁶ to n-C¹⁶ together with carbonyl compounds formaldehyde, acetaldehyde and acrolein.
In summary, both the tailpipe and vehicle cabin are likely to contain a wide range of volatile and semi-volatile organic compounds, some of which can have high toxic effects on humans, as well as other effects on animals, aquatic life and biodiversity. This is an important and urgent topic for future study, especially at a time when the levels of traditionally regulated tailpipe pollutants are getting so low. In short, the focus should be on particles, VOCs and greenhouse gases, whether they come from the tailpipe, cabin materials or tyres

Unless this wider view of vehicle emissions is taken, and the structure of the Euro regulations fundamentally reframed, they could hold as much currency as a 7 Euro coin.
Footnotes:
- https://www.ghgprotocol.org/sites/default/files/ghgp/Global-Warming-Potential-Values%20%28Feb%2016%202016%29_1.pdfof-air-pollutants/emissions-of-air-pollutants-in-the-uk-particulate-matter-pm10-and-pm25,
PM2.5
- http://www.envchemgroup.com/jacqui-hamilton.html
- https://echa.europa.eu/regulations/reach/legislation

Video: CRC Oral Presentation March 2021
Our CEO & Founder, Nick Molden recently spoke at the annual CRC Real World Emissions Workshop.
Our CEO & Founder, Nick Molden recently spoke at the annual CRC Real World Emissions Workshop.
In this presentation, Nick discusses: ‘Are gasoline vehicles being promoted over diesels as an artifact of the pollutants measured?’

Could vehicle automation make carbon dioxide emissions and air quality worse?
Declarations by the European Union (EU), United Nations, vehicle manufacturers and others, have left the widespread impression that connected and autonomous vehicles will reduce the environmental footprint of vehicles. But is this true?
This newsletter is jointly authored by representatives of Emissions Analytics and RDW, the Netherlands Vehicle Authority, bringing together work from each body on this topic of significant ongoing policy and investment interest.
Autonomous driving holds out the promise of improved road safety and mobility, and a cleaner environment. In fact, the European Commission in 2018 asserted that transport “…will be safer, cleaner, cheaper…” as a result of fully automated and connected mobility systems1. Other declarations by the European Union (EU), United Nations, vehicle manufacturers and others, have left the widespread impression that connected and autonomous vehicles will reduce the environmental footprint of vehicles. But is this true?

The claim is based upon more efficient operation, primarily as the result of smoother driving in the widest sense, including less aggressive accelerations and decelerations, better traffic engineering such as intelligent traffic light phasing, and inter-vehicle communications. Emissions Analytics considered these benefits in a study conducted with the Centre for Transport Studies at Imperial College London in 2017, called ‘Optimised Vehicle Autonomy for Ride and Emissions (OVARE)’ and part funded by Innovate UK.
But this study omitted consideration of the internal and external devices required to power the automation, and their energy consumption. Could it be that the benefits of automation are reduced or even eliminated when the whole system is considered? This newsletter will review the OVARE findings, and puts them together with analysis of the latest research on the energy requirement to determine what the net benefit is.
The OVARE project involved creating a traffic micro-simulation using the PTV-VISSIM software, coupled with instantaneous emissions factors derived from data from Emissions Analytics collected using Portable Emissions Measurement Systems (PEMS). Pollutants included were carbon dioxide (CO2), carbon monoxide (CO) and nitrogen oxides (NOx), together with fuel consumption derived using the carbon balance method.
The model was configured to use traffic volumes that reflect typical real-world conditions, with vehicles introduced to the simulated zone at five different entry points. Scenarios for 0%, 20%, 50% and 100% penetration of connected and autonomous vehicles (CAVs) were modelled. The results are shown in the table below2 for peak time traffic scenarios. The reductions during off-peak times were lower – typically 5% or less.

The potential 18% reduction in fuel usage and CO2 emissions is material in the context of the cost of transportation for consumers, energy security and climate change emissions. In the EU, CO2 emissions from passenger cars must be reduced by 37.5% between 2021 and 2035 – CAVs could therefore in principle achieve half of this reduction. Reducing NOx emissions by 21% would reduce the number of cities across Europe with non-compliant concentrations of nitrogen dioxide under the Ambient Air Quality Directive – CAVs could therefore lead to health benefits and reduce the need for costly interventions such as clean air zones. But, to reiterate, these outcomes do not factor in the potential impacts of the connectivity or automation systems themselves.
Now switching to the energy consumption side of the equation, we need to consider both the consumption by the on-board electronic devices required to run the automation and data processing that might take place in the vehicle, on the infrastructure side or in the cloud. For the purposes of the following calculations it is assumed that all vehicles are fully automated at SAE Level 5.
The devices required by this may include ECUs, cameras, lidar and radar – typically over 20 devices in total. With power ranges of between 1W and 80W each, an approximate total power requirement per vehicle would be 200W3. Based on data from the Netherlands – as an advanced European economy – the average number of driving hours per passenger car per year is 440 hours4, which implies an average electricity consumption from automation of 88kWh. Based on the Netherlands’ current energy mix5, with 1kWh resulting in 400g of CO2 emissions, the average battery electric vehicle would emit 35,200g per year. Taking an average distance travelled per car per year of 13,000km, this implies CO2 emissions of 2.7g/km, just from running the on-board devices. If the power were drawn from liquid fuel in an internal combustion engine, 1kWh would result in around 780g6, implying CO2 emissions of 5.3g/km.
More significant is energy required for data processing. Volvo has stated that autonomous driving requires “…a few GB [gigabytes] per second…”7. Other estimates vary, from 1.4 to 19TB [terabytes]/hour, so let’s be cautious and assume 0.4GB/second8. This would imply 634TB/year. Taking a cautious estimate of energy consumption from that data processing rate, we use 0.1kWh per gigabyte from Pihkola et al (2018)9. This conversion factor is subject to significant uncertainty, as set out in Aslan et al (2017)10, ranging from 0.023 to 7.1kWh. Using the same conversion of grid electrical energy to CO2 and distance travelled per year, the resulting estimate of CO2 emissions from data processing is an astonishing 1,950g/km. This compares to current average tailpipe CO2 emissions in the Netherlands of 121g/km and the 95g/km EU fleet average target – automation asks for at least 16 times more. Put another way, with an implied value of €95 per g/km from the EU fines for exceeding the 95g/km target, the ‘cost’ of automation would be around €185,000 per vehicle.

For illustration, if 25% of the processing happens on the vehicle, that would reduce the range of an average European internal combustion vehicle to around 160km. A battery electric vehicle with a 100kWh battery and 400km range would only be able to travel about 70km. This may well not even be physically possible, if the engine is not powerful enough to run the electronic systems and move the vehicle adequately at the same time.
This would clearly render automation unviable from both an emissions and cost point of view. The CO2 and fuel consumption benefits forecast by the OVARE project would be wiped out, as too would the NOx benefits in all likelihood. If the global supply of energy were to increase to the point of cheap, surplus renewable (zero carbon) energy, the CO2 issue would theoretically disappear, although there may still be too little power on board to move the vehicle. Increases in data processing efficiency would reduce the energy requirement and may solve this power problem, as would reducing the amount of data transfer between vehicles and with the infrastructure. On the other hand, increasing requirements around data security and vehicle safety may lead to ever-increasing power demands.
One solution may be to develop processor chips better designed for this type of computation, and thereby more efficient. This could become a significant differentiator between producers, analogous to the differences in battery design. A further solution may be to restrict the domain of automation, accepting that autonomous driving may only be viable within certain situations or geographic locations, rather than covering every conceivable case.

This analysis does not attempt to evaluate the secondary effects of automation on traffic volumes. If automation proves to be an attractive consumer proposition, especially if it accelerates the trends away from some forms of public transport and towards private options, this could make congestion worse. Not only would this waste productive time, but would have the risk of making air quality worse due to legacy internal combustion engines being forced to drive in a more stop-start fashion, and higher tyre and brake wear emissions from all types of vehicle.
In short, the prospect offered by autonomous vehicles has been asserted by many to be “cleaner”, and this generally has been believed without in-depth scrutiny. As with tailpipe emissions, and as with battery electric vehicles, the message must be that independent, real-world data is vital to inform the debate and policy formation, to ensure that consumers and the market are not led down another avenue that in practice makes air quality or carbon emissions worse, often fertilised by large amounts of taxpayer money.
Nevertheless, we acknowledge the uncertainties in the above analysis and potential future efficiency improvements. We would welcome contributions of recent test data from OEMs or suppliers for a follow-up newsletter. However, if these findings even broadly reflect the reality, they could lead to a rapid reassessment of the realistic potential and timing of fully automated driving for passenger vehicles.
As a first step, it would be helpful to move beyond a narrative that uses ‘autonomous’ and ‘low emission’ as almost interchangeably good things. They are not. They more likely trade off against one another.
Nick Molden, Emissions Analytics, United Kingdom
Peter Striekwold, RDW, The Netherlands
Footnotes:
https://ec.europa.eu/growth/content/europe-move-commission-completes-its-agenda-safe-clean-and-connected-mobility_en
Su, K. (2017) IMPACTS OF AUTONOMOUS VEHICLES ON EMISSIONS AND FUEL CONSUMPTION IN URBAN AREAS. MSc Dissertation, Imperial College London, and Hu, S. Stettler, M.E.J., Angeloudis, P. Karamanis, R. Molden, N. (2017). Impact of vehicle automation on emissions and ride comfort. Microsimulation for Connected and Autonomous Vehicles Workshop, Loughborough UK, 2017.
https://www.osti.gov/biblio/1474470
https://hblankes.home.xs4all.nl/Oud/snelheid.htm
https://www.cbs.nl/-/media/_excel/2018/04/tabelvoorartikelrendementco2emissieelekrtriciteit2017.xls
260g of CO2 in gasoline or diesel with 1kWh of embedded energy, adjusted for 33% combustion efficiency
https://www.vpro.nl/programmas/tegenlicht/kijk/afleveringen/2018-2019/De-rijdende-robot.html
https://www.tuxera.com/blog/autonomous-cars-300-tb-of-data-per-year/
https://pdfs.semanticscholar.org/be83/e9a9a7e10a7f29a846fc54d62f08ebe9e884.pdf
https://onlinelibrary.wiley.com/doi/full/10.1111/jiec.12630

WEBINAR REPLAY: RDE Surveillance and Compliance
Watch a replay of our recent webinar where Nick Molden explains how we can support with critical competitive benchmarking and off-cycle evaluations.

Title: RDE Surveillance and Compliance - - Independent data to enhance competitiveness and manage risk
First Shown: Tuesday 28th April - 16:30 GMT / 17:30 CET / 12:30 EST / 08:30 PST
Running time: 30 minutes + Q&A up to maximum of further 30 minutes
Content Overview:
The relentless intensity of RDE certification diverts resources away from critical competitive benchmarking and off-cycle evaluations. In a challenging market, such investigations can become a luxury.
We have a solution.
Emissions Analytics' independent EQUA database provides a cost-effective tool for certification, powertrain and emissions teams to understand their market position, the real risks of non-compliance and see which vehicles are setting new standards for emissions control.
With over 2,000 vehicles tested to date and hundreds more lined up for 2020, EQUA is the world’s largest commercially available real-world emissions database, with a unique bank of PEMS & OBD data. Over the years it has become an integral tool for vehicle manufacturers in Europe and North America to gather benchmarking intelligence and support R&D activities at the click of a button.
Join our Founder & CEO, Nick Molden, as he covers:
EQUA test process and methodology including cold-start, high load and hard acceleration
Database size, scope and detail
NEW – Technology supplier info including; engine, transmission, fuel injection, turbocharger
Ammonia (NH3) measurement data, ahead of Euro 7
European market update: WLTP, NOx and exceedance risk
US market update: emissions performance and real-world CO2 trends
Access to our data

Emissions Analytics Speaking at the International Vienna Motor Symposium
James Hobday will present ‘Managing Reputation and Emissions Compliance through Independent Testing’ at the International Vienna Motor Symposium in April.

James Hobday will present ‘Managing Reputation and Emissions Compliance through Independent Testing’ at the International Vienna Motor Symposium in April.
Now in its forty-first year, the event will bring together more that 1,000 decision-makers from the most important enterprises of the world’s automotive engineering industry.
Speaking at 11.45am on 24th April, James Hobday will look at how - using Emissions Analytics’ database of over 2,000 vehicle tests – emissions stakeholders can calculate risk ratings, identify weaknesses and benchmark between vehicles.
An increasing number of sources of compliance risk: homologation, conformity of production and in-service surveillance under Real Driving Emissions
Reputational and policy risk: media, consumer and political perception
How it’s not sufficient to hide behind flawed regulations (such as WLTP)
The need for a holistic view of pollutant emissions, carbon dioxide and fuel efficiency
The Emissions Analytics independent testing programme - covering hundreds of vehicles across three continents each year
How this data is analysed and available in a unique database that is accessed by a governments, industry and others
How EQUA Index helps manage these risks using the Emissions Analytics’ database of over 2000 vehicle tests, covering passenger cars, light commercial, heavy commercial and off-road
Calculating risk ratings, identifying weaknesses and benchmarking between vehicles
Registration for this event is open here.
If you’d like to discuss any of the above topics in more detail, then email James Hobday to book a meeting or call James on + 44 (0)207 193 0489.

The WLTP enigma
Is there something strange happening with WLTP?
The Worldwide Harmonised Light Vehicle Test Procedure (WLTP) is the new laboratory certification test for light duty vehicles in Europe. In particular, it is used for the fuel economy labelling of vehicles and the carbon dioxide (CO2) results will be used in labelling and manufacturer fleet average CO2 calculations. Missing the fleet average targets could trigger significant fines for manufacturers.

WLTP includes a more dynamic test cycle compared to the old New European Driving Cycle (NEDC), although it remains entirely in the laboratory. There is also a new legal framework, which removes some the loopholes and grey areas previously present, which were believed to contribute to the large gaps between certification values and the real world. Therefore, through the combination of the more dynamic cycle and fewer loopholes, the expectation was that WLTP results would see smaller discrepancies with real-world performance.
All cars sold from September 2018 must be WLTP certified, but the fleet average targets are still judged relative to NEDC values. Therefore, a translation mechanism has been created to derive NEDC-equivalent values from the WLTP test. The Joint Research Centre of the EU expressed concern about manipulation of this mechanism in 2018, and tightened the system as a result.
Is WLTP now functioning as intended? How do we judge?
Fortunately, Emissions Analytics has been conducting the consistent, standard EQUA Index test since 2011, bridging both systems. Over 1200 vehicles have been tested so far in this way. Using this data, we are able to compare the old NEDC figures, new NEDC figures and WLTP values to this consistent reference point to understand what has been happening.
There is a vital need to bring clarity, as the WLTP system is complex. Even if data is made freely available, it is hard to understand and analyse. Often, however, the CO2 data is not easily and comprehensively available. The following analysis relies on data quoted by manufacturers in their vehicle registration documents, except where it is demonstrably inaccurate.
The table below show NEDC values derived under the old system (NEDCNEDC), NEDC values under the new system (NEDCWLTP) and EQUA Index results for vehicles certified under NEDC and WLTP respectively (EQUANEDC and EQUAWLTP). NEDCWLTP results are primarily derived by processing the data from the WLTP test through a software package (CO2MPAS) provided by the EU. The process is complex and, in fact, the NEDCWLTPvalues could be modelled using CO2MPAS, manufacturer declared values or from actual dynamometer tests – therefore, the determination of NEDC-equivalent values under the new system is potentially open to manipulation as its complexity does not assist transparency.
The table summarises the average CO2 emissions for all pre- and post-WLTP vehicles tested up to 3 litres in size. In total, 25 WLTP cars have been tested so far that have a full set of publicly-available data.
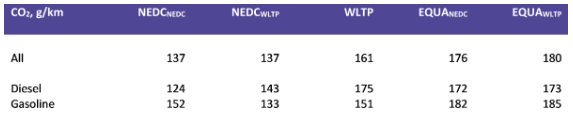
To start, it is worth noting that the real-world emissions on the EQUA Index sit well above the current 130 g/km fleet average CO2 target, let alone the 2021 95 g/km 2021 target. But most striking are the differences in trends between diesel and gasoline vehicles, as shown in the table below.

Across all the Euro 6 cars tested prior to the introduction of WLTP, the average CO2 gap was 32%. Cars certified to WLTP over the last one-and-half years show a smaller gap of 13%, as expected. However, below these intuitive headlines are some perplexing trends. For example, the gap between the EQUA Index and the NEDC for diesels has shrunk, while it has expanded for gasoline vehicles – to the point that there is no systematic gap between the EQUA Index and WLTP for diesels, but there is a 24% gap for gasoline.
To verify that this is not an artefact of the vehicles tested, comparing the average CO2 for EQUA results under the NEDC compared to EQUA Index results under the WLTP showed a difference of just 2%. Furthermore, the average engine sizes of the two cohorts were considered, and were broadly similar:

Therefore, it is clear that there has been a significant change in the relative certification values of diesels and gasoline, despite no change in the real-world performance as measured by the EQUA Index.
So, what can we conclude about the health of the WLTP system?
The table below summarises the findings. The comparison of WLTP to NEDCWLTP results is intuitive and in line with EU forecasts. The health of the translation system is primarily being policed by looking at this difference because of the concern that OEMs were simultaneously inflating WLTP values and suppressing NEDC values, to create the biggest gap, so that future WLTP-based fleet average CO2 reductions were based off an inflated start point. The results below suggest this issue is not occurring on a significant scale.
The difference between NEDCWLTP and NEDCNEDC should be positive, as the new type approval framework removes loopholes – but there is a significant negative gap for gasoline vehicles. In other words, CO2 values have fallen despite the test getting tougher. Comparing WLTP to the average NEDC values on under the old regime shows a big rise in CO2 for diesels, but virtually no change for gasoline vehicles.

A potential explanation for these movements is that focus and expertise have been put into optimising gasoline vehicles on the new WLTP cycle, driving the official CO2 down despite this not translating into better real-world performance. The increase in official diesel CO2emissions may be partly explained by the larger average engine size of engines so far tested.
If this turns out to be true, it would give further credence to the argument for including on-road testing in the official CO2 certification process, to limit the ability to optimise to the test. In the meantime, the use of WLTP results for fuel economy labelling will be hardly more useful to consumers that the old, discredited NEDC system it replaced.
European Court annuls Real Driving Emissions limits: the potential consequences
The General Court of the European Union overturned the emissions compliance levels under the new Real Driving Emissions (RDE) regulation in a verdict announced on 13 December. On the surface of it, this may look like a victory for cities wanting to be tougher on emissions of nitrogen oxides (NOx) from passenger cars and vans.

The General Court of the European Union overturned the emissions compliance levels under the new Real Driving Emissions (RDE) regulation in a verdict announced on 13 December. On the surface of it, this may look like a victory for cities wanting to be tougher on emissions of nitrogen oxides (NOx) from passenger cars and vans. In reality, it has the potential to further complicate the Euro 6 regulatory stage and thereby create the unintended consequence of making it even less usable for urban vehicle policy.
While the European Commission did not seek to increase the headline 80 mg/km emissions limit for diesel vehicles, which must still be adhered to in the laboratory test, they granted “Conformity Factors” that in effect did increase the limits for the harder, on-road part of the test. As a result, all diesels vehicles only had to meet 168 mg/km by September 2019, falling to 114 mg/km by January 2021. This was in practice a large increase in the permissible emissions limit.
The Court verdict suggests that vehicles already certified under Real Driving Emissions (that starts with the stage known as “Euro 6d-temp”) will remain compliant, as will vehicles certified for up to 14 further months in the future, depending on whether the Commission appeals and the speed with which replacement legislation is brought forward.
But what is this likely to mean in practice?
Let us assume that there is no appeal and no new legislation, meaning vehicles must meet 80 mg/km on the RDE test. Taking a sample of 30 RDE-certified diesel cars tested by Emissions Analytics on its independent EQUA Index test, we conclude that up to 90% of the vehicles would still be compliant. Although the test does not include cold start in its ratings, overall it remains a good proxy for RDE compliance. Furthermore, the average NOx on a combined cycle of these still-compliant vehicles is just 50 mg/km, well below the certification standard. Of the remaining 10%, they all come from the same OEM, Honda, which would in this scenario need to make changes.
This suggests the impact would be low. However, RDE does not become mandatory for all vehicles sold until September 2019. Therefore, it is likely that this conclusion is flattered due to a self-selecting sample of the best performing cars. If we look at the wider population of pre-RDE Euro 6 diesel cars, we may have a proxy for the challenge to each manufacturer of no Conformity Factors.
The table below shows the proportion of pre-RDE Euro 6 diesels from a range of manufacturer groups that meet various emissions levels, on our real-world scale. For example, 33% of all BMW/Mini Euro 6 diesel vehicles tested by Emissions Analytics achieve a rating of ‘A’.
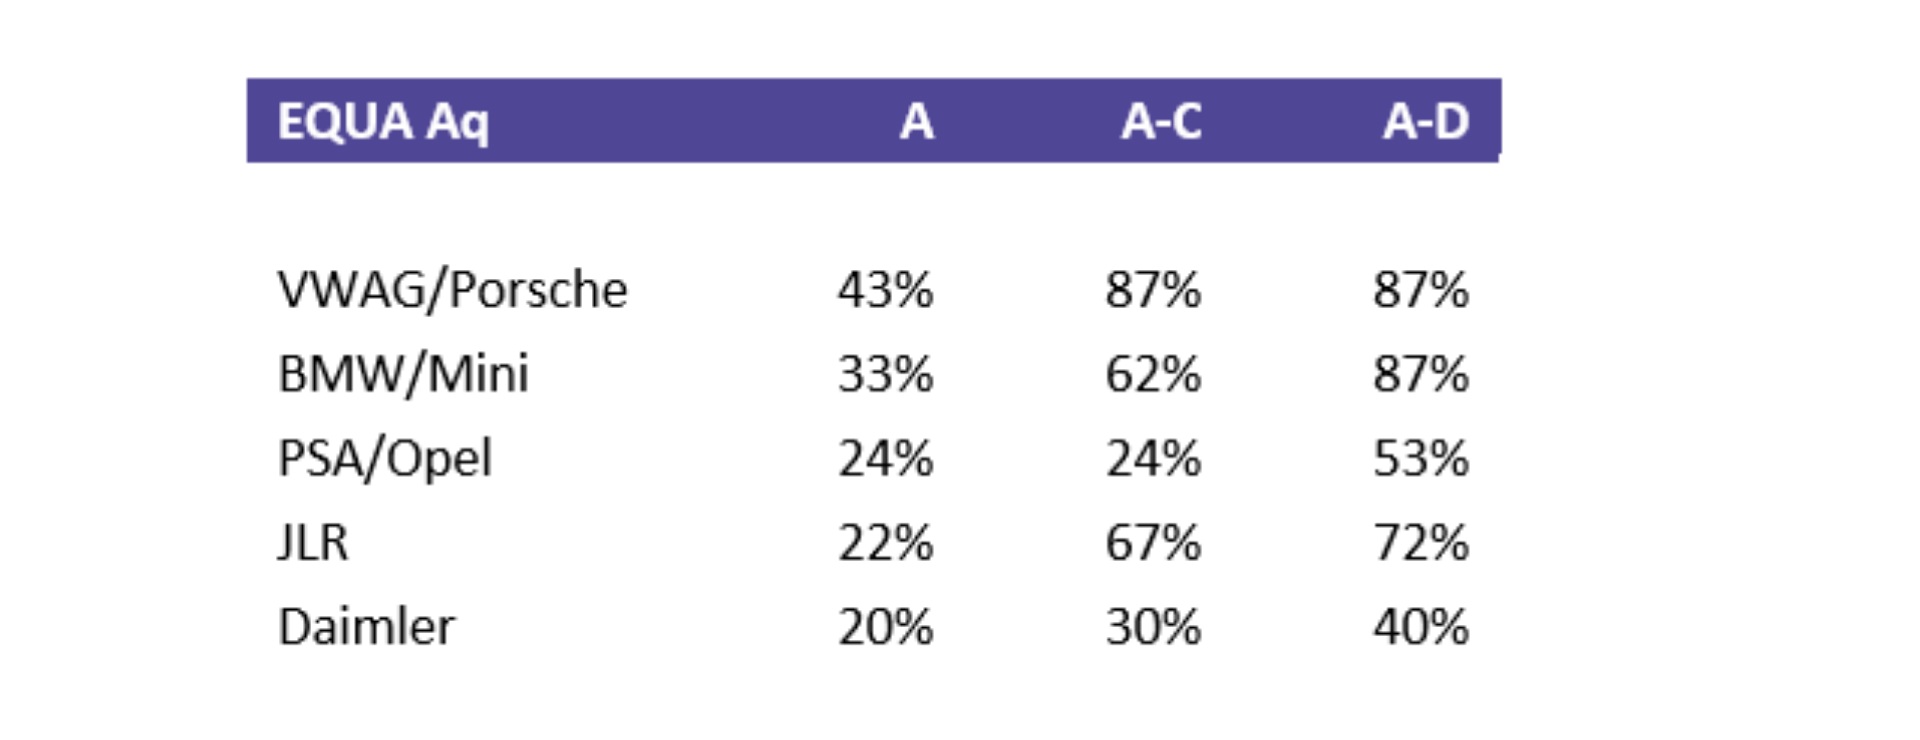
The ‘A’ rating is equivalent to 80 mg/km; ‘A’ to ‘C’ is equivalent to 180 mg/km (the Euro 5 level, close to the 2.1 Conformity Factor level); ‘A’ to ‘D’ is equivalent to 250 mg/km (Euro 4).
Approximately, the Conformity Factors allowed ratings of up to ‘C’, but with this annulled, ‘A’ ratings would need to be achieved. The table lists the five manufacturer groups that would be best placed to meet this requirement – assuming their pre-RDE performance is a proxy indicator of how close they are to achieving 80 mg/km across their whole range. VW Group, therefore, is best placed overall; Jaguar Land Rover has made the most rapid advances in the last year.
The final column of the table indicates the proportion that meet ‘A’ to ‘D’. This is relevant to the 270 mg/km maximum limit proposed in an agreement between the German government and cities, to be judged in real-world conditions. The ‘D’ rating is a near equivalent to this level. While the 270 mg/km limit is currently only proposed to apply to Euro 4 and 5 diesels, in time it could be extended to Euro 6 vehicles. If this were to happen, the table shows what proportion of these manufacturers' vehicles may be restricted from the 14 German cities cited. Therefore, VW, BMW and JLR would be the least affected of all. In addition, this is before the benefit of the fixes and retrofits that have been, or may be, actioned, which would further reduce the restrictions. In contrast, there are manufacturers that could face having all their Euro 6 diesels restricted.
Overall, this may give reassurance to some, but there is a wider risk. The annulment of these Conformity Factors further confuses what “Euro 6” means as a label of performance. RDE was meant to be a discontinuity with the past, failed regulation. It had two levels already – two Conformity Factors – but the effect of the Court judgement could lead a change in the gradations or, potentially, more gradations. The Euro 6 label has limited informational content already, but the effect may be to cloud what RDE means, causing further consumer confusion, which would not be to the advantage of the car market.
The Court judgement is witness to the growing power of cities in determining vehicle emissions policy, even if they sometimes demonstrate an unresolved tension between whether air quality improvement or greenhouse gas emissions reduction is the higher priority. What the Court judgement may do is bring into starker relief the difference between the best and worst performing vehicles, which would pave the way for more efficient solutions to the urban air quality challenge.
New Real Driving Emissions regulation increases pressure on annual inspection and maintenance testing system
The European Union Roadworthiness Directive came into force on 20 May 2018 and will play a role in enforcing type approval emissions limits, subtly but powerfully changing its role and previous focus on safety, to the benefit of air quality.
The European Union Roadworthiness Directive came into force on 20 May 2018 and will play a role in enforcing type approval emissions limits, subtly but powerfully changing its role and previous focus on safety, to the benefit of air quality.
In the new inspection and maintenance test, known for example as the MOT test in the UK, a ‘major’ defect and automatic fail arises from any visible smoke being emitted by any car equipped with a diesel particulate filter (DPF), meaning in practice the majority of vehicles since late 2009 (Euro 5 onwards).
The definition of ‘visible smoke’ has only tightened up for vehicles registered after 1 January 2014, meaning late Euro 5 and all Euro 6. Permitted smoke for these cars has more than halved from 1.5m-1 to 0.7m-1. This measurement is familiar to any MOT tester and denotes opacity, where 0.0 m-1 is totally clear and 10.00 m-1 is totally black. In practice, less than 0.7m-1 is judged to be invisible and more than 0.7m-1 will be visible.
For vehicles from 1 July 2008 to 31 December 2013, the standard is 1.5m-1, while the smoke standard for older cars remains unchanged, at 2.5m-1 (non-turbo) 3.0m-1 (turbo).
Air quality campaigners have been quick to note the perversity of a tougher test that only applies to newer cars. However, it has long been politically unfeasible to apply new standards to old cars, which would see the wholesale removal of vehicles that met their type approval at the time of their manufacture.
The revised smoke test for vehicles since 2014 is likely to catch out cars where the DPF is absent or defective. Particulate emissions rise by orders of magnitude when the DPF is missing or blocked. In the UK, 1800 cars have been caught without a DPF since 2014, but the true figure is believed to be much higher because it is notoriously difficult for testers to identify DPF removal in the small amount of time taken to perform the MOT.
In an exercise Emissions Analytics conducted in 2017 with BBC 5 live Investigates, a car with its DPF removed still passed its MOT at three (out of three) different garages. Mechanics failed to spot the filter had been taken out on each occasion, and the car was not failed for opacity.
To quantify the difference between having a DPF and not having a DPF, Emissions Analytics technicians tested a 9.0 litre commercial diesel engine before and after the installation of a DPF retrofit. The particle number (PN) and particle mass (PM) afterwards were close to zero, so the reduction was over 99%. Therefore, tampering would increase the emissions by orders of magnitude.

As this problem of DPF removal detection has not been eliminated, it is believed that the tougher smoke test will most likely identify missing filters, although we think a greater degree of tester training and adherence to test processes is also required.
A weakness of the new test is that is does virtually nothing to enforce emissions limits for nitrogen dioxide (NOx). Emissions control equipment is only subject to a visual check for its presence, including the oxygen sensor, NOx sensor and exhaust gas recirculation valve.
Should any of these items be ‘missing, obviously modified or obviously defective’, the car fails the test. However, the new (UK) MOT Manual skimps over this area by suggesting in section 8.2.2.1 (Exhaust emission control equipment for diesel engines), telling testers, “You only need to check components that are visible and identifiable, such as diesel oxidation catalysts, diesel particulate filters, exhaust gas recirculation valves and selective catalytic reduction valves.” We suspect that in numerous cases this requirement will be neglected owing to the continued difficulty of determining the presence of some of these items, or because of commercial pressures to complete tests quickly.
Almost all Euro 5 diesel cars had no NOx after-treatment, just exhaust gas recirculation (EGR), while their Euro 6 successors typically received the addition of either a Lean NOx Trap (LNT) or a Selective Catalytic Reduction (SCR) system. Therefore, as a rough equivalence, a Euro 6 car with failed after-treatment may emit at a level more akin to an equivalent Euro 5 vehicle.
Emissions Analytics has tested numerous Euro 5 and 6 cars on its on-road EQUA Index (www.equaindex.com) route. For example, a Euro 5 VW Golf 1.6 litre diesel emitted 0.557 g/km of NOx, while its LNT-equipped Euro 6 successor emitted 0.161 g/km, a reduction of 71%.
Then take the larger Mercedes C-Class 2.1 litre diesel. In Euro 5 guise it emitted 1.226 g/km of NOx; and with SCR fitted to the Euro 6 version the same engine emitted 0.396 g/km, a reduction of 68%.
From these results it is clear that to disable these treatments (with an “emulator” or similar) or where they have malfunctioned, NOx could increase by a factor of over 3.
However, the dilemma in setting an in-service NOx standard is that the performance of vehicles when brand new varies from around 20 mg/km to over 1500 mg/km – the issue uncovered as a result of the dieselgate scandal. A vehicle normally producing 20 mg/km that is malfunctioning might produce 800 mg/km, whereas a different model may produce 800 mg/km when in a fully functioning condition. Therefore, a real-world reference number is required to judge the in-service performance. The EQUA Index rating, which is a standardised test on the vehicle when new, could act as this reference value to increase the accuracy of identifying malfunctioning vehicles.
One unmistakable outcome is that what was once mainly a test for roadworthiness has now become a more complex enforcement of type approval emissions, at the very moment when those limits are tightening up within WLTP/RDE.
The inspection and maintenance system has in this sense risen in importance as a tool for policing emissions, because non-compliant vehicles will display vastly increased emissions, by orders of magnitude. However, the failure to test properly for NOx misses one of the major problems that Europe faces, in the wake of its dieselisation, while the ultrafine particles produced by downsized, direct injection petrol engines are also missed. It feels as though the new test is distinctly lacking in these crucial areas, leaving much more work to be done.

Mayor delivers online checker to help car buyers choose less polluting new vehicles
Mayor delivers online checker to help car buyers choose less polluting new vehicles. Read the press release here.


Air quality…it’s hotting up
Will 2015 be recognised as a turning point in the campaign for clean air? It certainly has the potential to as there are a number of threads which, if they come together, could determine the future prospects for urban air quality in Europe.
Will 2015 be recognised as a turning point in the campaign for clean air? It certainly has the potential to as there are a number of threads which, if they come together, could determine the future prospects for urban air quality in Europe.
For instance, the second stage of the Euro 6 regulations for passenger cars will come into force from September. All new cars registered will need to meet reduced limits for NOx, albeit still measured on the artificial laboratory New European Driving Cycle (NEDC).
Also, negotiations will come to a head in the EU around the Conformity Factor for the third stage of the Euro 6 regulations. This will see the use of Portable Emissions Measurement Systems (PEMS) becoming mandatory for the first time. Emissions Analytics has argued long for such portable testing in real-world driving, so this is significant progress. However, a high Conformity Factor (the permissible exceedence of the regulated limits) for a long period could limit the effectiveness of the regulation.
Additionally, the UK government must come up with a new air quality plan after its defeat in the Supreme Court. The activist legal group, ClientEarth, accused the government of failing to meet legal limits for air pollution and the Supreme Court found in its favour, instructing the government to draw up a new plan by the end of 2015.
So, let’s take stock of what Emissions Analytics’ real-world test data is telling us on these points.
The second stage of the Euro 6 regulations is likely to reinforce the existing trend of significantly reducing NOx, but there will still be large exceedances over the regulations. Emissions from Euro 6 diesels are on average 0.340 g/km when they should be 0.08g/km, although this is a 54% reduction on the 0.736 g/km from Euro 5. The issue is much less for gasoline vehicles, which are on average 24% below the 0.06g/km limits. However, 22% of vehicles tested by Emissions Analytics did not meet the limit.
Regarding the Conformity Factor at the third stage of Euro 6, there is growing evidence that, in time, a low factor is viable. Across all Euro 5 diesels we tested, just one met the regulated level. So far for Euro 6 four have already met the limit, using a mix of selective catalytic reduction (SCR) and lean NOx trap (LNT) after-treatment systems. There is still much work to do, but the evidence shows that the limits themselves could be met.
A new version of the UK’s air quality plan is being written by the Department for Environment, Food and Rural Affairs and Secretary of State Liz Truss has announced consultation “later this year”. Crucial in our view will be the understanding and modelling of primary NO2 emissions, as this is a major contributor towards roadside pollution yet is not specifically regulated by Euro 6. Emissions Analytics has found that the variation in this fraction of NO2 in NOx between models has also grown, as a result of differences in after-treatment technologies; for Euro 6 diesels it is 17%-80%, where previously is was 27%-70% in Euro 5 models.
To assist the industry in making a success of Euro 6, Emissions Analytics recently launched an online database of its results, which will be updated in real-time as it continues its rolling test programme. We don’t know yet how these important developments will impact urban air quality but we will be tracking it closely.


Real Driving Emissions – are you ready?
Emissions Analytics was recently asked to write an article for Automotive World’s Megatrends magazine. This month’s newsletter is a summary of that article which considers the potential impact of the proposed changes to the New European Drive Cycle.
Emissions Analytics was recently asked to write an article for Automotive World’s Megatrends magazine. This month’s newsletter is a summary of that article which considers the potential impact of the proposed changes to the New European Drive Cycle.
Emissions Analytics’ data resource, from tests on more than 800 vehicles, is transforming the economics of obtaining emissions data for OEMs who are tasked with understanding and acting upon the proposed legislative changes concerning Real Driving Emissions (RDE) and the move towards the World Harmonised Light Test Cycle and Procedures (WLTC/P).
The new testing system, developed by global representatives for the United Nations Economic Commission for Europe is due to be finalised in the spring of 2015. This test cycle is more representative of real-world driving and the test procedures should be more robust than those associated with the New European Drive Cycle (NEDC).
One of the reasons for the proposed change is the growing gap between the number of miles per gallon certified during the NEDC test and the fuel economy achievable by real drivers on the road which can be seen clearly below.
Using Emissions Analytics’ real-world data, the blue line on the graph below illustrates how this gap is growing, at about two percentage points per year, and is likely to continue to expand if left unchecked. With the introduction of the WLTC/P in 2017, we predict the gap will close by between half and two-thirds (shown below in green), depending on how stringent the final protocol is.
Although this will bring the European divergence closer it will not equal the USA variance, where the more stringent five-cycle system is in operation.

Bold line: EA data
Dashed line (historical): Other sources of data
Dashed line (future): Model based prediction by EA
The European Parliament and European Commission have proposed this new test be introduced in 2017, although there are challenges and opposition from some parts of the automotive industry that would like longer to adapt to the changes.
One of the challenges facing OEMs is the profile of the NEDC replacement, the WLTC. The International Council on Clean Transportation has estimated that the effect on the EU CO2 target value will be an increase of around 5-8%. Emissions Analytics believes the increase could be higher than this. If nothing were changed in the targets, OEMs would need to deliver further efficiencies in their vehicles, and consumers in some countries could find themselves paying more vehicle tax.
There is a methodology under development for translating the existing NEDC results into WLTC, but this is still work-in-progress and has limitations. What is clear is that forewarning of how current vehicles perform on the test can bring significant benefits to the engineers developing the vehicles which will be on the road when the WLTC/P is adopted. This is why some manufacturers use Emissions Analytics’ data to ensure compliance and to stay competitive, benchmarking their own progress against that of their closest rivals.
In times when manufacturers are under increasing pressure to be open and honest about their vehicles’ true in-use performance, plus with the imminent legislative changes which will formalise this requirement, there has never been a greater need for a reliable and robust source of data which can offer the insight and intelligence needed.
Emissions Analytics will shortly be making their data available to the automotive sector directly via a new, subscription based software platform called RDEanalytics. More will follow on this in a later newsletter but for a sneak preview or to find out more email us now.

March 2014 – Transatlantic testing
This month, in preparation for a presentation we are giving at the 24th CRC Real World Emissions Conference in San Diego, we have been making a detailed examination of the data we are collecting in America.
This month, in preparation for a presentation we are giving at the 24th CRC Real World Emissions Conference in San Diego, we have been making a detailed examination of the data we are collecting in America.
In most respects the emissions testing we perform in the USA is identical to the work we do in the UK. We use the same equipment, the same methodology (with some adjustments to account for factors such as the widespread use of air conditioning in California) and even our technicians travel between sites to ensure continuity in our processes.
In the UK, the data is published by What Car? magazine under the brand True MPG and in the USA it is published by Motor Trend magazine as Real MPG.
However, despite consistency in the testing process there are marked differences in the results. One of the most noticeable differences between the UK and the USA is that the statutory figures provided by the Environmental Protection Agency (EPA) are a closer match to real world figures than those generated using the New European Drive Cycle (NEDC). As can be seen in this graph, Real MPG is within 1% of the EPA combined figure compared with an average of 18% below statutory in the UK.
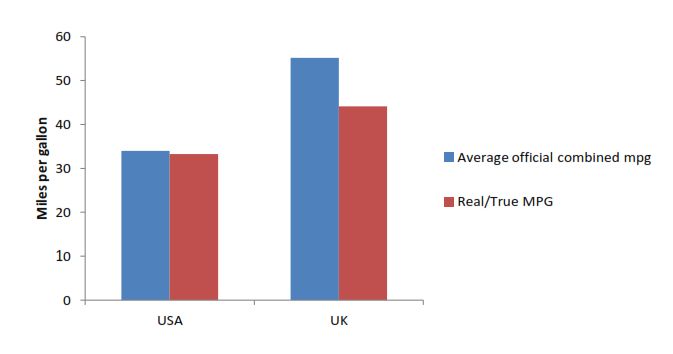
The test cycle in the USA was improved in 2008 and now involves five tests: the city, highway, high speed (up to 80mph), hot (with air con) and cold at 20°F (-7°C). The total distance of the five tests is 43.9 miles and takes 1 hour 35 minutes to complete, compared with 6.8 miles and 19 minutes 40 seconds in the UK. In the US, 15% of new models are tested by the EPA to check the manufacturer figures, and failure to come within 3% of the published result can lead to a hefty fine.
Some more comparisons between Emissions Analytics’s data from the UK and USA can be seen in the table below.

It would appear from the test data gathered to date in the USA that the EPA figures are well calibrated to average driving, although variations in the real world can lead to divergence from this by up to 20%. We are now running at full speed in the USA and will be testing upwards of 250 passenger cars per year. It will be interesting to see if a gap between statutory and real world fuel economy starts to appear as the pressure to deliver the best fuel economy label grows.

February ’14 – NOx in the News
In the press last week was the news that the European Commission has launched legal proceedings against the UK for failing to deal with air pollution.
NOx in the news
In the press last week was the news that the European Commission has launched legal proceedings against the UK for failing to deal with air pollution. Britain was supposed to meet EU limits set out in the Air Quality Directive by 2010 but the government has said these levels will not be reached until 2020 in most areas and in London it is likely that they will not be met until 2025.
The main cause of these air-borne contaminants regulated by the EU is diesel engines, but why is Britain so far from the target?
A real-world view of NOx
Although auto manufacturers have introduced a number of modifications to meet the ever tightening controls of NOx emissions, a study conducted by Imperial College London and Emissions Analytics, on Euro 5 light-duty diesels, shows the real-world figures exceed Euro 5 standards threefold in most instances.

In the graph above you can see that all the cars in the sample failed to meet Euro standard 4 or 5 and, only three reached Euro standard 3. It can also be seen that the real-world average NOx emissions is considerably higher than the limits set out in the regulations. This is the same situation we see with fuel efficiency when we measure cars for True MPG, comparing their statutory mpg figures to performance in the real world. However, due to high levels of NOx being produced during stop-start driving, such as in traffic, the resulting gap between regulated and real-world air pollution is even more pronounced.
The reasons for Britain breaching EU regulations are many and complex; both NOx and miles per gallon standards are calculated using the New European Drive Cycle, the shortcomings of which have been widely reported and are supported by Emissions Analytics’ large volume of real-world data. Others have voiced concerns regarding the number of monitoring stations and the use of modelled data in EU Air Quality Directive compliance assessments. What it is clear is that real-world data has an important part to play in policy making.
Euro 6 and beyond…
With the introduction of Euro 6 demanding a drop in NOx of 80 per cent on the previous standard, EA and Imperial are continuing their study to see what the impact of this new ruling will be. Emissions Analytics is also developing a new traffic simulation model which will calculate the effect of speed and congestion on fuel economy, as well greenhouse gas (CO2) and air pollution (NOx and CO) components underpinned by the data from its real-world test of more than 400 models of passenger car.
Archive
- AIR Alliance 3
- Air Quality 38
- Audio 3
- Climate Change 14
- EQUA Index 21
- Electrified Vehicles 28
- Euro 7 3
- Fuel Consumption/Economy 20
- Fuels 4
- Infographic 18
- Media 4
- NRMM/Off-road 3
- Newsletter 103
- Podcast 7
- Presentation/Webinar 18
- Press Release 19
- Regulation 16
- Reports 4
- Tailpipe Emissions 49
- Tyre Consortium 2
- Tyre Emissions 26
- Vehicle Interior 6