

Podcast: Emissions Analytics featured in CoMotion Postcast
Nick Molden , CEO and Founder had the privilege of being invited onto CoMotions podcast. On the podcast Nick discusses the question on everyone’s mind how can we quickly and cheaply decarbonize mobility?


What matters is not the promise of electric vehicles but the actuality
Friday 18 September 2015 saw Dieselgate break. This was the culmination of a growing dissonance between real-world nitrogen oxide (NOx) emissions and official values for cars and vans. The rupture was created by governments picking a technology, for the purposes of decarbonisation, where too much was taken on trust within a fragile governance system.
Friday 18 September 2015 saw Dieselgate break. This was the culmination of a growing dissonance between real-world nitrogen oxide (NOx) emissions and official values for cars and vans. The rupture was created by governments picking a technology, for the purposes of decarbonisation, where too much was taken on trust within a fragile governance system. The industry said, rightly, that technology existed to solve the NOx emissions. The sad reality was that this technology wasn’t deployed in a way that actually reduced NOx enough in practice, and Europe has been dealing with the air quality consequences ever since.
Equivalent failures must not happen as we try new routes to decarbonisation, especially as a generation has been lost with the diesel experiment. Many air quality problems have been solved even with internal combustion engine technology, with the simpler challenge remaining of updating the car parc. But decarbonisation is harder, and that is why the promise of battery electric vehicles (BEVs) – the leading contender in light-duty vehicle CO2 reduction – is rightly being scrutinised in exhaustive detail.

Mr Bean actor and car collector Rowan Atkinson’s recent intervention, saying he felt “duped” by the green claims of BEVs, caused a stir, not least because the article appeared in The Guardian, a well-regarded, environmentally conscious UK newspaper. Much electronic ink has been spilt since, including a subsequent ‘fact check’ by Simon Evans, a climate journalist, in the same publication. In the spirit of open enquiry and technology neutrality, and given the importance of the topic, we decided to perform a ‘fact fact check.’ In doing this, Emissions Analytics’ only motive is to get as close to the truth as possible, and to acknowledge where we have uncertainties.
In headline, most of what Simon Evans wrote is true, including:
BEVs won’t solve all the problems associated with car use. Our comment: very true, and may in some specific cases make them worse.
BEVs reduce greenhouse gas emissions by two-thirds on a lifecycle basis relative to combustion engine cars in the UK, and the benefits are growing. Our comment: performing accurate lifecycle analysis is exceedingly hard, and the answer is sensitive to your choice of model and input assumptions. The two-thirds claim is in the range of plausible estimates, even though Emissions Analytics’ work put the estimate closer to half currently. Nevertheless, the point stands.
Emissions from producing batteries are significant, but are quickly outweighed by the in-use emissions from gasoline and diesel cars. Our comment: how quickly depends on the true lifecycle emissions of the battery, vehicle and fuel, but it is most likely to be in the two to seven year range in the UK (with a wider range across Europe). Given that a car typically lasts about 13 years, anywhere in this range could be deemed quick.
Hydrogen is not a mainstream and proven technology in the same was as BEVs are currently, although it may improve too. Our comment: we agree – it is predicted to improve, and may emerge as the preferred solution for freight transport where the size of the battery is problematic.
Battery electric technology is the most energy efficient of the alternatives. Our comment: true, noting that efficiency is an important but not the only consideration.
Batteries may well outlast the rest of the vehicle. Our comment: data on battery longevity is encouraging on the whole.
Lithium-ion batteries do not contain rare earth elements. Our comment: batteries often contain scarce materials, and rare earths are used in electric motors.
However, there is one sentence in the article that we should focus on in particular. Not that it is incorrect, but that it is true in a dangerous way:
“Indeed, without a widespread shift to EVs, there is no plausible route to meeting the UK’s legally binding target of net zero greenhouse gas emissions by 2050…” [To clarify, in context “EVs” meant BEVs, excluding hybrids.] This sentence is important because it is a fact, but it is a fact by definition. In other words, legislation defines BEVs as zero emissions. Bingo! But are they actually zero emissions? No, as Simon Evans correctly points out. The manufacturing and electricity-generation emissions are defined out of the equation. The manufacturing emissions are mostly parked offshore; in practice most of them occur in China, where battery materials and processed before they can be utilised.
So, we have a rapidly looming echo of Dieselgate. You cannot define your way to decarbonisation. Repeating the assertion that BEVs are zero emission doesn’t make it any more true. BEVs in the UK are lower carbon than any current alternative – that is true. But they come at a cost and with consequences – economically, geopolitically, environmentally, ethically – that make them no more than a highly promising and valid alternative alongside many others.
Let’s not wake up on Tuesday 18 September 2035 to find that we have applied gargantuan resources, failed to reduce CO2 enough, and created new unpleasant side-effects.
So, Rowan Atkinson may be right for the wrong reasons, and others wrong for the right reasons. The truth is that Europe, and the world, perhaps cannot afford another Dieselgate.
Environmental justice
The term ‘environmental justice’ can often be used in a mushy, socialistic sense, but behind it is a deadly serious concept. Put broadly, it means that all parts of society should be treated equally under environmental law, or that everyone has the right to the same protection from pollution and other harm from emissions.
Why distributional efficiency matters
The term ‘environmental justice’ can often be used in a mushy, socialistic sense, but behind it is a deadly serious concept. Put broadly, it means that all parts of society should be treated equally under environmental law, or that everyone has the right to the same protection from pollution and other harm from emissions. More strictly, it can be seen as a form of allocative efficiency. In other words, environmental interventions should be directed where they create the most benefit, up to the point that the marginal benefit equals the marginal cost of delivery. Protection from emissions shouldn’t be the preserve of the rich or powerful, but should be judged beneficial for anyone to whom it can deliver a net improvement in the quality of life. Applying this concept is important in any free society where people are not all living in the same circumstances, with the same preferences and behaviours.
Through this lens, we can develop an additional perspective on the current debate around the decarbonisation of transport. In doing so, we can see that a multitude of solutions is the optimal approach not just because of constraints on resources, the actions of hostile states, and the state of our electricity grids, but also because people are diverse, and society’s interests are best served by giving each person the most suitable mode of transport.

Switching from an internal combustion engine (ICE) vehicle to a battery electric vehicle (BEV) is an investment. As well as the obvious financial investment on the part of the buyer, it is an environmental investment in the sense that higher carbon dioxide (CO2) emissions are generated during manufacture which are then offset during the usage of the vehicle. As a good guide, the CO2 footprint of BEVs is greater than that of ICE vehicles because of the emissions from making the battery, as the elimination of the engine and other components is roughly offset by the electric motors. Further, electricity generation according to the average mix in Europe or the US creates about as much CO2 as the oil extraction, refining and distribution. Therefore, switching to a BEV initially makes CO2 worse, until a ‘break-even’ point is reached after a period. It should be well noted that these averages are offered as a rule-of-thumb in order to simplify a complex picture and reveal the break-even concept, not to downplay the actual variability and spread in manufacturing emissions, grid mix and so on in specific places.
Estimates of how long into the life of a vehicle the break-even point is reached vary widely, as the result is sensitive to the interaction of the following main factors:
Carbon intensity of the electricity grid
Embedded carbon in battery manufacture
In-use vehicle emissions rates
Distance driven per year.
Electricity grids vary from near-zero CO2 in France to largely coal in Poland – in the latter scenario most BEVs never pay back the manufacturing CO2. Embedded carbon in battery manufacturing typically varies between 2.5 and 16 tonnes, which is driven by a combination of mining, refining and transporting the wide range of rocks and minerals required. In-use emissions from modern gasoline engines average around 184 g/km according to Emissions Analytics’ real-world EQUA testing on European vehicles, but most fall in the range from 107 g/km for the best fully hybridised engines to 248 g/km for non-hybridised sports utility vehicles. As a result, even assuming average driving distances per year, you can get almost any answer for the CO2 break-even date, depending on your location and the type of the comparator vehicles. As a guide, most commonly cited break-even points fall between two and eight years.
This analysis, however, neglects the vital element of the distance driven per year, which is often – as above – assumed away as some representative average. According to Field Dynamics, in 2019 – pre-Covid – the average UK car was driven 7,124 miles (11,470 km). The UK is around the average of European countries in this respect. The distribution of annual miles across all cars subjected to periodic technical inspection (PTI) saw the majority of cars with less than 5,000 miles per year (8,050 km) and just 0.5% above 30,000 miles (48,300 km). This matters because the fewer miles driven, the longer it takes to reach the break-even CO2 point. The table below compares trading in your old ICE vehicle for a typical BEV, rather than changing to a typical full hybrid electric vehicle (FHEV) emitting 120 g/km.

* Proportion split pro rata from original report.
On the other factors above, typical average values have been taken: average grid carbon intensity for Europe and seven tonnes of embedded carbon in the battery. Calculations here take the mid-point of the distance ranges, and the top group is assumed to have an annual mileage of 35,000. The CO2 and break-even calculations assume driving behaviour is the same between the different vehicles. It is further assumed that vehicles have a twelve-year useful lifespan on average; while many last longer than this, the number of miles driven falls rapidly as they enter a twilight life of reduced use. We should note that there is a potential bias in these numbers as vehicles are not subject to the PTI test in the UK until three years old.
These results prove that the more intensively a BEV is used, the quicker it will pay back the CO2 investment. For the heaviest users, that payback will be within one year, and deliver about ten times the overall CO2 savings than in the original battery manufacture. At the same time, the lightest users never practically pay back that investment if they switch to a BEV, only offsetting half of the battery emissions. Therefore, those light users are much better switching to the FHEV. Most crucial is the proportion of cars that fall into this category: about one third. If these people take the FHEV option rather than switching to the BEV, the overall reduction in CO2 across the fleet would be 17% greater, and the reduction in the need for scarce battery materials would be around 32%.
This proportion will of course be lower in countries with cleaner grids, where the batteries have been manufactured using cleaner energy and the in-use emissions of the ICE vehicles are higher. Equally, the proportion will be higher in the opposite circumstances.
Applying a similar calculus to the US, we see that it is generally a much more suitable region for vehicle electrification. While it shares a similar pattern of grid electricity to Europe – majority based on fossil fuels, with big variations between regions – other factors work to its advantage. First, US car owners travel around 13,500 miles (21,600 km) per year on average, almost double the European average of about 7,000 miles (11,200 km). Therefore, a US driver pays back the CO2 invested in a BEV's manufacturer in half the time. Second, US wholesale energy costs around one quarter of Europe’s, so it can more credibly and competitively build the necessary extraction and processing supply chain, rather than just the final battery assembly part. Third, North America is the global region with the highest degree of urbanisation, and BEVs offer the biggest efficiency gains in urban driving, due to powertrain efficiency at slow speeds and regenerative braking.

In summary, this analysis can be put as: why are we forcing light car users to spend more money on vehicles that actually pollute the planet more? While Zero Emission Vehicle (ZEV) mandates may be direction-finders and worthy aspirations, it is also very important we make sure that those who do convert to BEVs are the right people, from an allocative efficiency point of view. ICE bans are even more problematic than ZEV mandates because ‘success’ would be wilfully suboptimal A better approach would be to drop the bans and be highly selective with mandates, and rely more on the CO2 targets and/or carbon pricing to set the direction and then let the industry and consumers rearrange their supply and demand accordingly to deliver the best environment outcome in the most efficient, speedy and equitable way. In this way, lightly used cars would not be swapped for BEVs, saving money and CO2. That would be true environmental justice.
The inevitability of hybridisation?
While the direction of vehicle powertrain policy and strategy is firmly oriented towards full battery electric vehicles (BEVs), the results of Emissions Analytics’ latest testing and lifecycle modelling suggests that hybridisation may prove to be the dominant outcome, whether intended or not.
While the direction of vehicle powertrain policy and strategy is firmly oriented towards full battery electric vehicles (BEVs), the results of Emissions Analytics’ latest testing and lifecycle modelling suggests that hybridisation may prove to be the dominant outcome, whether intended or not. As real-world emissions results collide with consumer preference and fiscal reality, the efficiency of hybrids in reducing carbon dioxide (CO2) emissions is likely to shine through over the next decade, even if BEVs and other new technologies come to dominate in the longer-term.
Put another way, at the moment it appears that battery electric vehicles (BEVs) are neither sufficiently clean nor a strong enough consumer proposition to achieve mass adoption without significant subsidy. They are certainly not zero emission, not least due to the construction process and tyre wear emissions. Hybrids, in contrast, reduce tailpipe CO2 emissions materially now – albeit somewhat less than BEVs – and have few utility disadvantages for consumers. Therefore, would it be optimal to follow a hybridisation strategy for, say, the next ten years and then segue to BEVs after that, once they are cleaner and have fewer consumer disadvantages?

The typical objection to this is that BEVs already in the fleet will automatically become cleaner as the grid decarbonises. While this is true, the greatest source of CO2 from BEVs is in the manufacture, which is fixed and incurred upfront. Therefore, every BEV manufactured now may crystallise enough CO2 today to outweigh the subsequently lower CO2 of operation, compared to typical hybrid vehicles.
Taking the latest sales figures for new cars from the UK’s Society of Motor Manufacturers and Traders (SMMT), and putting them together with recent test results for exhaust and non-exhaust emissions from Emissions Analytics, it possible to evaluate the progress in decarbonisation.
Before turning to CO2, it can immediately be seen that BEVs deliver little overall advantage for air quality. While NOx emissions remain positive for internal combustion engines (ICEs), the levels are significantly lower than for earlier models. This is true to the extent that, if the car fleet were made up entirely of these latest diesel and gasoline cars, there would be no air quality legal violations. For particle mass emissions, exhaust filters on ICEs typically reduce emissions to less than 1 mg/km. In contrast, tyre emissions from ICEs are around 32 mg/km over a lifetime, whereas the BEV tyre wear rate – other things being equal – are 21% higher at 38 mg/km. Adding exhaust and non-exhaust emissions together, BEVs are slightly higher emitting than ICEs and full hybrid electric vehicles (FHEVs).
With BEVs not required for air quality compliance, their primary environmental purpose is CO2 reduction. The table below estimates the CO2 emissions saved compared to the benchmark gasoline ICE for each alternative powertrain, based on 16,000 km of annual driving and the latest market shares of each. The greatest aggregate CO2 reduction is from BEVs, which have 8.4% market share. Hybrids, collectively, with 34.0% market share, account for around three-quarters of the reduction of BEVs.

These BEVs include around 5.5 million kWh of battery capacity, compared to 1.0 million kWh in all the hybrids together. Therefore, for every kWh of battery capacity, BEVs delivered 3.0 g/km of CO2 reduction, compared to 13.7 g/km for hybrids, both judged against the gasoline ICE benchmark. In other words, hybrids have been 4.6 times more efficient at reducing CO2 as a function of the currently constrained battery material supply.
Had the battery material from the 92,420 BEVs sold been used in hybrids – assuming average battery capacities of 60 kWh and 2.6 kWh respectively – an additional 2.1 million hybrids could have been built, enough to cover all new cars sold in the whole of 2021 in the UK. In that hypothetical scenario, the CO2 reduction from the annual operation of the hybrid vehicles would be 940 kilotonnes greater than from the BEVs.
To analyse more fundamentally the differences between the powertrains, it is necessary to consider lifecycle CO2 emissions, including vehicle manufacture, operation and end-of-life processing. To that end, Emissions Analytics has developed its own proprietary model; for the purposes of this analysis the key assumptions are:
15-year, 175 km vehicle lifespan
60 kWh BEV battery size
150 kg/kWh of CO2 in battery production
300 g/kWh of CO2 for BEV charging.
Considering the cumulative CO2 emissions to 2070, it is possible to compare six different scenarios as shown in the table below. The three powertrain scenarios are an ICE-led baseline, a direct migration to BEVs, and an interim switch to FHEVs until 2030 and then migration to BEVs. Each of these scenarios has two versions: one calculated based on current CO2 intensity of electricity generation and BEV manufacture, the other with that intensity reducing by 50% from 2030.

The reason for BEVs being hardly better than FHEVs on current CO2 intensity is that the manufacture emissions of the vehicle and battery are still relatively high, and the average grid electricity across Europe still includes significant gas and coal.
Therefore, we can deliver an extra 8% point reduction in CO2 compared to the baseline by switching straight to BEVs, if a 50% reduction in CO2 intensity is achieved from 2030. According to the fifth carbon budget under the UK’s Climate Change Act, the country can emit 1,725 million tonnes of CO2-equivalent between 2028 and 2032. The added benefit given by the direct migration to BEVs is over 10% of that carbon budget – which demonstrates how every percentage point of reduction in CO2 is important.
On the surface of this analysis, BEVs look like the optimal strategy, even though the gap to the FHEV strategy is closer than reported elsewhere. However, this neglects consideration of risk. Rolling out hybrids would be relatively low risk due to limited resource requirements, consumer resistance and taxpayer subsidy requirement. Furthermore, the BEV estimates of CO2 reduction are sensitive to many factors, including:
Speed and degree of decarbonisation of battery and vehicle manufacture
Speed and degree of decarbonisation of the grid
Improvements in battery energy capacity and therefore vehicle range
Longevity of batteries and BEVs as a whole
Geopolitical security around scarce battery materials
Environmental and ethical issues around mining
Degree to which vehicle miles travelled in BEVs replace ICE miles, or are additive due to the lower marginal cost
Ability to develop a transparent and standardised lifecycle model to be able objectively to verify CO2 reduction claims.
Each of these could have a material impact on the analysis and resulting CO2 reduction, both positively and negatively. However, as high-certainty methods of CO2 reduction are a pressing policy need, it may be better to ‘bank’ the lower-risk 24% reduction from ten years of hybrids, and then migrate to BEVs and other lower-CO2 powertrains.
Returning to the topic of currently scarce battery materials, the FHEV strategy requires 39 GWh of battery capacity for vehicles sold in the ten years to 2030. In contrast, the BEV strategy requires 570 GWh, or 15 times more. From a practical, ethical and geopolitical point of view, this is significant.
There is, further, a paradox with BEVs: once bought, from a CO2 point of view it makes sense to drive them a lot so the embedded emissions in the construction can be amortised across the maximum usage. It may even be better to drive incremental miles in the car rather on some forms of public transport. This is, therefore, linked to the question of taxing BEVs such there are no perverse incentives to drive on the road more, and creating replacement revenues for the declining taxes on gasoline and diesel.
Putting together this rate of CO2 reduction and the current utility compromises, it suggests that BEVs are not yet good enough value a product to get rapid adoption without significant subsidy. With new internal combustion engines now sufficiently clean that they are not contributing to air quality violations and the readily available alternative in hybrids, it appears that the optimal policy is to concentrate on them for the coming years while BEVs and other low-CO2 powertrains get ready for mass adoption. Greater competition would be good for consumers in the long term, especially where greater proportions of the added value in the vehicles arise domestically, whatever the country. Vast sums of taxpayer subsidy – billions, if not tens over billions, of pounds over time – could also be avoided.

Failing this, it is likely that we end up at hybridisation by another route: at the household level. This is because consumers may hold on to old ICEs to cover longer journeys, heavier payloads, sporty driving and the like. These older vehicles may also have higher NOx emissions, being Euro 6 prior to the introduction of Real Driving Emissions, or earlier. Governments may try to force these off the road through higher taxation, but this is unlikely to work as the low depreciation rates of these older vehicles will make for cheap motoring in almost any scenario.
In summary, surely it would be better to take the pragmatic route and hybridise everything as soon as possible?
This conclusion is not dissimilar from that articulated in a facsheet from the International Council on Clean Transportation in July 2021, which said, "Hybridization can be utilized to reduce the fuel consumption of new internal combustion engine vehicles registered over the next decade, but neither HEVs nor PHEVs provide the magnitude of reduction in GHG emissions needed in the long term."
But, the numbers suggest we replace "can" with "should", to lock in the CO2 savings now.

The rise of unregulated exhaust pollutants
When the various pandemic lockdowns across Europe failed to bring about the overall improvements in air quality that might have been expected, Emissions Analytics’ interest focused in on volatile organic compounds (VOCs) and their potential role.
But which ones really matter on the road?
When the various pandemic lockdowns across Europe failed to bring about the overall improvements in air quality that might have been expected, Emissions Analytics’ interest focused in on volatile organic compounds (VOCs) and their potential role. While nitrogen oxide (NOx) emissions fell with traffic levels, often ground-level ozone (O³) rose, leading to similarly bad air quality from a human health point of view, just of a slightly different complexion. In fact, this should not have been a surprise as the complex interaction of NOx, VOCs and O³ has long been studied¹. The South Bay in Los Angeles has grappled with this problem since motor vehicles proliferated, and many US air quality regulations have stemmed from the experiences there.

Recent newsletters from Emissions Analytics have, therefore, looked at sources of VOCs including vehicle tyres (What's in a tyre?) and materials (Euro 8: Rethinking Vehicle Emissions Fundamentally). This newsletter returns to the tailpipe to see what VOCs and other currently unregulated pollutants are being emitted in real-world, on-road driving. This is aimed at taking understanding beyond the ‘total hydrocarbons’ that are regulated using a laboratory test in Europe, and non-methane hydrocarbons that are regulated in a number of territories including the US. This research is being conducted against the backdrop of the current discussions around the proposed new ‘Euro 7’ regulation, which may include some hitherto ignored pollutants including particular species of VOCs.
Measuring a wide range of organic compounds and other volatile species at the tailpipe is a challenge due to the large number of different compounds – many hundreds, if not thousands – as well as their volatility, which can make them hard to capture. While this can be done in the laboratory, it is an even greater challenge on the road. Traditional portable emissions measurement systems (PEMS) measure total hydrocarbons (THC) using a flame ionisation detector (FID). This can deliver robust measurements, but it creates some operational challenges, not least from the need for a supply of combustion gas. Furthermore, only a single figure for total hydrocarbons is produced; it does not include non-hydrocarbon VOCs and does not separate the different species of hydrocarbons.

To address these challenges and limitations, Emissions Analytics has developed a proprietary, patent-pending system, that harnesses sample collection from the exhaust onto tubes while driving, which are then analysed later using laboratory gas chromatography. Using this, we can measure the concentrations of VOCs as well as semi-volatile organic compounds (SVOCs) – together covering compounds from with two carbon atoms (C2) up to at least 44 carbon atoms (C44) – formaldehyde (CH2O), nitrous oxide (N₂O), sulphur dioxide (SO2) and many others. Therefore, both the breadth of compounds measured and the speciation challenges are solved. Furthermore, the measurements can be highly sensitive, picking up very low concentrations, which may be critical for highly toxic species. The chromatogram below illustrates the large number of distinct compounds that are present in a typical exhaust, with the height of the peaks generally indicating relative amounts.

When deployed together with a traditional PEMS unit, with its capability for measuring total exhaust flow, the concentrations of VOCs can be turned into mass values. Combined with the GPS speed data, the distance-specific emission rates can be calculated, giving mg/km figures as is the basis for regulating most gaseous emissions.
The limitation of this approach is that the sample collection on tubes is cumulative over the test cycle and, therefore, there is no second-by-second signal. This creates two problems. First, when the average concentrations are multiplied by the total exhaust flow, the result is biased due to the highly variable nature of both the target gas concentration and exhaust flow at the instantaneous level. Second, the result is a combined value for the whole test cycle, without any breakdown between different driving modes.
Our approach addresses both limitations. The sample bias issue is overcome using a proprietary on-board constant volume sampling and proportional flow dilution system. To give a breakdown of the combined cycle into useful sub-sections, a geofencing system automatically switches between different sample tubes to sample, for example, urban, rural and motorway driving separately.

A notable advantage of the sample tube approach, from a practical and analytical point of view, is that it separates sample collection from sample analysis. This reduces the complexity of the vehicle test itself, which improves the success rate. Having the sample captured on a tube means that it can be analysed later, in batches for efficiency, and each sample can be analysed multiple times, which is useful for validation and uncertainty analysis. For the purposes of our tests, we use a two-dimensional gas chromatography (GCxGC) system coupled with a time-of-flight mass spectrometer (TOF-MS) from SepSolve Analytical and Markes International. The GCxGC achieves a separation of the hundreds of compounds that would not be possible in a one-dimensional system. The TOF-MS is crucial for identification of the compounds, as well as quantification, which is aided by other detectors such as a FID and electron capture detector (ECD) for N₂O.
Putting these techniques into practice, Emissions Analytics tested eight recent gasoline vehicles in Europe. All were 2020 or 2021 model years, with four standard internal combustion engines, two mild hybrids, one full hybrid and one plug-in hybrid – drawn from eight different brands. All were tested on the standard EQUA Index test cycle set out in previous newsletters and the basis of all data in the Emissions Analytics’ subscription database. While similar to a certification Real Driving Emissions (RDE) test, it has a wider range of dynamic driving and is about twice as long.
The N₂O results are set out in the table below, split between urban, rural and motorway driving. In each case the highest and lowest emitting cars are highlighted. Greatest emissions were seen in rural driving, with urban driving the lowest.

Emissions of N₂O are potentially important as the gas is a much more powerful greenhouse gas than carbon dioxide (CO2). Over a 100-year horizon, it has warming potential 265 times greater2. Therefore, small amounts of N₂O could undermine the extensive efforts to reduce primary CO2 from engines. On average, across the eight vehicles and three driving modes, the N₂O emissions were 2.1 mg/km. Converted to an equivalent CO2 this is just above half a gram. Real-world CO2 emissions of these test vehicles averaged 142 g/km. Therefore, these N₂O emissions were equivalent to well below 1% of total CO2 – within the measurement error of the CO2 value.
Formaldehyde is a pollutant of concern as it is believed to be carcinogenic and causes a wide range of irritation in humans, including to skin, eyes and lungs. The results from the same eight vehicles are shown below.

Again, highest emissions were seen in rural driving. Although the exact human health effects depend on factors such as the dilution and dispersion of the emissions, it can be seen from the data that there is about a factor of four difference between the cleanest and dirtiest cars.
Turning to other VOCs and SVOCs, the tubes captured over 500 different compounds from each vehicle. Some of these were common to most or all, but other compounds were characteristic of specific vehicles. Taken together, each vehicle has its own chemical signature. The table below shows the top compounds that were common to each vehicle, together with their toxic effects. It should be noted that the actual effects on humans depend on the concentrations experienced.

By way of contrast, the differentiating compounds are shown below. The compound listed is the most abundant chemical with particular prevalence in that vehicle.

On this first pass, therefore, there is good reason to move beyond the simple measure of total hydrocarbons and non-methane hydrocarbons in various regulations around the world. The next stages are to consider the absolute quantities of the compounds, model their dispersion in the environment, understand their toxic effects, and study their propensity to create secondary organic aerosols, i.e. solid airborne particles created as the SVOCs react in the atmosphere.
These initial results demonstrate the capability to identify and measure a wide range of VOCs and SVOCs in real-world driving – compounds that can have a wide range of deleterious effects on human health and the environment. The N₂O results may call into question the priority of adding this pollutant to the new Euro 7 regulation as the effects on global warming may be insignificant and come at the price of higher priced cars with the added regulatory burden. Better to focus on the ongoing effects of VOCs, whether the direct effect on humans and the biosphere, as precursor to ozone and smog, or as they lead to formation of airborne particles matter – which we will look at in a later newsletter.

Video: The Situation with Air Quality in Europe
Following our successful We have forty million reasons for failure, but not a single excuse newsletter, our Founder & CEO, Nick Molden delves deeper into the situation with air quality in Europe.
Following our successful We have forty million reasons for failure, but not a single excuse newsletter, our Founder & CEO, Nick Molden delves deeper into the situation with air quality in Europe.


Eight principles of decarbonisation
Elimination of carbon dioxide from transport must be real not artefact
Elimination of carbon dioxide from transport must be real not artefact
The United Kingdom has enacted a law for net-zero carbon dioxide (CO2) emissions across the economy from 2050, and other countries will likely follow. This has spawned a policy of targeting zero emissions from transportation, which is often spoken about interchangeably with the idea of replacing the vehicle fleet with battery electric vehicles (BEVs). A further benefit of this change is claimed to be improvement in air quality, due to the absence of a tailpipe, and the resulting health benefits. But is this apparent panacea as simple as it sounds?

Slowing climate change is now widely regarded to be of such importance that all ideas need to be robustly tested not just for the glamour of their ambition, but whether they can deliver. Admitting the existence of risk, a mix of approaches may be more robust than gambling all on red. Unintended consequences must also be considered for fear of achieving the goal but at an unacceptable price. As The Economist said in August 2020, “…Mr Xi is shifting to a sharp focus on supply-chain choke-points where China is either vulnerable to foreign coercion or where it can exert influence abroad. That means building up self-sufficiency in key technologies, including semiconductors and batteries.” The reality is that there is already, and will continue to be, a widely predicted global supply constraint on batteries for the rest of this decade if take-up of BEVs is as healthy as it needs to be to fulfil zero carbon transportation.
For transport, then, the right policy could be expressed as delivering zero carbon dioxide (including other gases with equivalent greenhouse gas effects) emissions with no worsening in other pollutants and no vexatious secondary effects. At least, any trade-offs should be understood scientifically and communicated politically. This newsletter will consider what would be necessary and sufficient to achieve this, and the implications.
So, let us set out Emissions Analytics’ Eight Principles of Decarbonisation – the material things that need to be delivered to achieve the stated policy:

Principles 1 and 2 are a significant enough challenge in themselves, but progress is being made in that direction by many countries. There remains a significant issue in the intermittency of many renewable energy sources, especially where there is no nuclear baseload. This newsletter will not go into these further, but unless they are achieved, the advantages of BEVs will be seriously compromised, whatever else is achieved in respect of the other principles.
Principle 3 arises from carbon being a global problem: the total matters, not the source. Reducing upstream CO2 emissions is a very serious challenge given the lack of control that governments can apply to foreign mining and manufacturing operations. It is also material, due to the higher CO2 emissions currently from BEV compared to ICE manufacture, like-for-like. Efforts are being made by manufacturers, including recent reports from BMW and others, to assert some control and transparency, but it remains a significant challenge. Even the transportation of vehicles by sea would need to be completely decarbonised to achieve this, which may conceivably be achieved with alternative fuels such as ammonia produced with zero carbon electricity.
Principle 4 is a growing challenge, with the need to recycle various rare earth metals from drive motors and batteries, or give them a second life before eventual recycling. This is a business opportunity that is already attracting entrants, yet achieving this with zero-carbon energy remains a stretching goal.
Principle 5, means that other emissions that have a global warming effect – often expressed in CO2-equivalence – should be included in analysis, to ensure one climate-charge-relevant emission is not swapped for another, through singular focus on CO2. This could include, for example, methane emissions from gas vehicles or nitrous oxide (N2O) from certain after-treatment systems.
Principle 6 is an important but complex one. This could mean that vehicles should not ‘crowd out’ the use of batteries from existing non-transportation uses. For example, where batteries may be used as static power sources or for powering handheld tools, if demand from transportation made battery prices too high, these uses may switch back to combustion engines. It could also mean that old ICEs that are replaced with BEVs in developed countries are exported to expand fleets in developing countries as their values fall.
Recalling the Dieselgate crisis, where nitrogen oxide (NOx) emissions were found to be insufficiently regulated in a way that led to damagingly high emissions in the real world, there is a big risk from the non-exhaust emissions from BEVs, especially in regard to tyre wear. Due to the weight of batteries, BEV vehicles are significantly heavier that like-for-like ICE vehicles. As a result, for the same grade of tyre and driving patterns, non-exhaust emissions from wear on those tyres will be higher for the BEV. The regenerative braking for BEVs may lead to lower brake wear emissions compared to ICEs, but this is unlikely to counterbalance the increased tyre wear emissions. Therefore, the risk is that the CO2 reduction from BEVs is traded for a degradation in air quality and other microplastic pollution.
Through our work on measuring pollution inside the vehicle cabin, we have observed that hybrid vehicles often have worse interior particle concentrations, which may lead to worse exposures and health effects for occupants. The hypothesis is that, due to the energy requirements, filtration is minimised as these vehicles are sold for their fuel efficiency. Therefore, CO2 may be traded off against human health in this additional dimension.
While carbon credits, Principle 7, may act as a positive incentive mechanism for carbon reduction, inherent in the system is their trading effectively permits the continued use of combustion engines by the purchasers. Therefore, while they may be expedient in the short run, they must be phased out permanently.
Principle 8 is simple: to achieve zero carbon, the whole ICE and hybrid fleet on the road must be replaced. It is likely that the last few percent of vehicles will be hard to shift due to stubborn owners, and therefore the incentives needed may be high. In conjunction with Principle 6, old ICE vehicles should be responsibly recycled, not exported to developing economies, to avoid the scandals associated with the scrappage scheme following the financial crash of 2008, when dirty diesels were ‘scrapped’ at the expense of taxpayers only to be found to have been exported to Eastern Europe and beyond.

Last year, we published this newsletter which showed that hybrids were the best way to reduce CO2 in a world of limited battery capacity. Full hybrids deliver around 30% CO2 reduction compared to the nearest equivalent ICE, compared to the 100% tailpipe reduction of BEVs; but 14 times more hybrids can be built for the same battery capacity, meaning hybrids could actually deliver four times more CO2 reduction than BEVs while the battery constraint remains.
While limited battery capacity remains true for now, let us project forward to a hypothetical world of unconstrained and cost-competitive battery supply. In addition, we also make the critical assumption that all electricity will be zero carbon (Principles 1 and 2). We assume that complete grid decarbonisation will be achieved. We also assume that manufacturing CO2 emissions (Principle 3) remains the same as currently, but also that there is no improvement in ICE efficiency. Further, we are putting no negative value on the utility limitation of the reduced range of BEVs compared to ICEs, which may well persist even when batteries are plentiful in supply and cost competitive due to the weight they add to the vehicle.
To assess these effects, Emissions Analytics has created its own model of the CO2 effects of electrification. Three scenarios were modelled: complete switched to BEVs and full hybrids compared to the ICE baseline.
The manufacture emissions of ICEs, full hybrids (FHEVs; for clarity these exclude mild hybrids and plug-in hybrids, but sit between them in terms of battery size, and rely only on on-board gasoline or diesel for energy) and BEVs are 5.8, 6.2 and 11.4 tonnes per unit1. In use, the average CO2 emissions are 111, 78 and 0 g/km. Assumed annual usage of all three are 16,000km over a lifetime of 200,000km. On the switch-to-BEV strategy, the new car sales mix is assumed to be 100% BEV by 2040, and the whole fleet by early 2050s.
Crucially, as CO2 is cumulative in the atmosphere – it lasts between 300 and 1,000 years once emitted – we must consider cumulative emissions in our analysis. This is the basis of the Paris agreement and countries’ carbon budgets.
On this BEV scenario, cumulative total CO2 emissions emitted are higher for over a decade due to the front-loaded emissions in the manufacture of the BEVs. From 2034, the cumulative CO2 is lower than the benchmark ICE strategy as the benefits of zero in-use emissions begin to outweigh the higher embedded emissions from manufacturing and batteries. By 2070, cumulative emissions are 811m tonnes lower from BEVs. However, this is only 47% down on the ICE strategy; in 2050 it is only 23% down. So, unless you can eliminate manufacture emissions, we are not even close to zero emissions – even ignoring Principles 5 to 8.
If you double average battery size, and therefore double the CO2 in their manufacture, to compensate for the bounded utility of BEVs and bring range more in line with ICEs, then the reduction by 2070 is just 11%, and it is 1% worse still in 2050.
Revisiting the potential for hybrids set out last year, the BEV strategy can also be compared in this model to a FHEV strategy of switching the whole vehicle fleet to FHEVs by the earlier 2050s, and it yields dramatic results.
The BEV strategy is still superior, but the total CO2 reduction by 2050 is just 11% and by 2070 it is 26%. Good, but far from zero. Less good is if you double average battery size, when cumulative CO2 emissions are 5% worse from BEVs than FHEVs.
These results stem from the higher manufacturing emissions of BEVs, which are true not just in the initial switch to BEVs but on subsequent future vehicle replacement, together with the lower in-use CO2 from hybrids. This will only change if Principle 3 is delivered – hence its vital importance. The cynic may think that net vehicle importing countries may be quite content to ‘off-shore’ rather than genuinely reduce the emissions.

Although the legal position is that net zero must be achieved by 2050, from the point of view of climate change, what happens in the next twenty years is just as important. Carbon dioxide has no discount rate. Every gram of CO2 that is reduced now makes the challenge post-2050 easier. Therefore, inaction today on the promise of a miracle solution tomorrow is not a robust policy.
Unless a more robust policy is developed, delivering real and measurable CO2 reduction soon, it is likely around 2035 that BEVgate will break, where much of the promised reduction will have proved illusory and air quality may be worse. As it took 15 years from the introduction of explicit NOx reduction under the ill-fated Euro regulations until Dieselgate, it may be 15 years from now that the folly of dogma rather than facts becomes clear. And our carbon budgets will by then be spent.
Footnotes:
- Derived from https://www.volkswagen-newsroom.com/en/press-releases/electric-vehicles-with-lowest-co2-emissions-4886; in-use emissions for FHEVs applies 30% efficiency estimated by Emissions Analytics

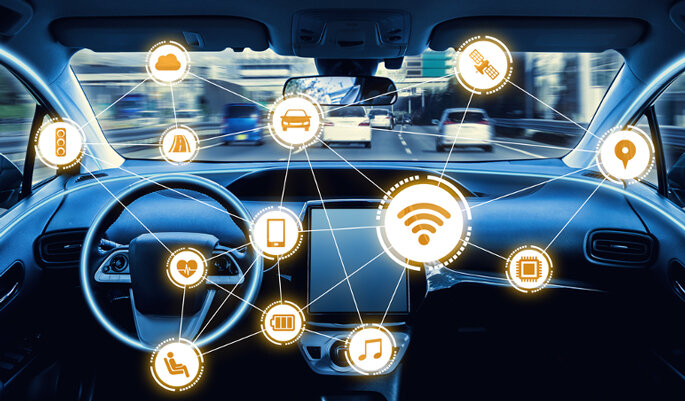
Could vehicle automation make carbon dioxide emissions and air quality worse?
Declarations by the European Union (EU), United Nations, vehicle manufacturers and others, have left the widespread impression that connected and autonomous vehicles will reduce the environmental footprint of vehicles. But is this true?
This newsletter is jointly authored by representatives of Emissions Analytics and RDW, the Netherlands Vehicle Authority, bringing together work from each body on this topic of significant ongoing policy and investment interest.
Autonomous driving holds out the promise of improved road safety and mobility, and a cleaner environment. In fact, the European Commission in 2018 asserted that transport “…will be safer, cleaner, cheaper…” as a result of fully automated and connected mobility systems1. Other declarations by the European Union (EU), United Nations, vehicle manufacturers and others, have left the widespread impression that connected and autonomous vehicles will reduce the environmental footprint of vehicles. But is this true?
The claim is based upon more efficient operation, primarily as the result of smoother driving in the widest sense, including less aggressive accelerations and decelerations, better traffic engineering such as intelligent traffic light phasing, and inter-vehicle communications. Emissions Analytics considered these benefits in a study conducted with the Centre for Transport Studies at Imperial College London in 2017, called ‘Optimised Vehicle Autonomy for Ride and Emissions (OVARE)’ and part funded by Innovate UK.
But this study omitted consideration of the internal and external devices required to power the automation, and their energy consumption. Could it be that the benefits of automation are reduced or even eliminated when the whole system is considered? This newsletter will review the OVARE findings, and puts them together with analysis of the latest research on the energy requirement to determine what the net benefit is.
The OVARE project involved creating a traffic micro-simulation using the PTV-VISSIM software, coupled with instantaneous emissions factors derived from data from Emissions Analytics collected using Portable Emissions Measurement Systems (PEMS). Pollutants included were carbon dioxide (CO2), carbon monoxide (CO) and nitrogen oxides (NOx), together with fuel consumption derived using the carbon balance method.
The model was configured to use traffic volumes that reflect typical real-world conditions, with vehicles introduced to the simulated zone at five different entry points. Scenarios for 0%, 20%, 50% and 100% penetration of connected and autonomous vehicles (CAVs) were modelled. The results are shown in the table below2 for peak time traffic scenarios. The reductions during off-peak times were lower – typically 5% or less.

The potential 18% reduction in fuel usage and CO2 emissions is material in the context of the cost of transportation for consumers, energy security and climate change emissions. In the EU, CO2 emissions from passenger cars must be reduced by 37.5% between 2021 and 2035 – CAVs could therefore in principle achieve half of this reduction. Reducing NOx emissions by 21% would reduce the number of cities across Europe with non-compliant concentrations of nitrogen dioxide under the Ambient Air Quality Directive – CAVs could therefore lead to health benefits and reduce the need for costly interventions such as clean air zones. But, to reiterate, these outcomes do not factor in the potential impacts of the connectivity or automation systems themselves.
Now switching to the energy consumption side of the equation, we need to consider both the consumption by the on-board electronic devices required to run the automation and data processing that might take place in the vehicle, on the infrastructure side or in the cloud. For the purposes of the following calculations it is assumed that all vehicles are fully automated at SAE Level 5.
The devices required by this may include ECUs, cameras, lidar and radar – typically over 20 devices in total. With power ranges of between 1W and 80W each, an approximate total power requirement per vehicle would be 200W3. Based on data from the Netherlands – as an advanced European economy – the average number of driving hours per passenger car per year is 440 hours4, which implies an average electricity consumption from automation of 88kWh. Based on the Netherlands’ current energy mix5, with 1kWh resulting in 400g of CO2 emissions, the average battery electric vehicle would emit 35,200g per year. Taking an average distance travelled per car per year of 13,000km, this implies CO2 emissions of 2.7g/km, just from running the on-board devices. If the power were drawn from liquid fuel in an internal combustion engine, 1kWh would result in around 780g6, implying CO2 emissions of 5.3g/km.
More significant is energy required for data processing. Volvo has stated that autonomous driving requires “…a few GB [gigabytes] per second…”7. Other estimates vary, from 1.4 to 19TB [terabytes]/hour, so let’s be cautious and assume 0.4GB/second8. This would imply 634TB/year. Taking a cautious estimate of energy consumption from that data processing rate, we use 0.1kWh per gigabyte from Pihkola et al (2018)9. This conversion factor is subject to significant uncertainty, as set out in Aslan et al (2017)10, ranging from 0.023 to 7.1kWh. Using the same conversion of grid electrical energy to CO2 and distance travelled per year, the resulting estimate of CO2 emissions from data processing is an astonishing 1,950g/km. This compares to current average tailpipe CO2 emissions in the Netherlands of 121g/km and the 95g/km EU fleet average target – automation asks for at least 16 times more. Put another way, with an implied value of €95 per g/km from the EU fines for exceeding the 95g/km target, the ‘cost’ of automation would be around €185,000 per vehicle.

For illustration, if 25% of the processing happens on the vehicle, that would reduce the range of an average European internal combustion vehicle to around 160km. A battery electric vehicle with a 100kWh battery and 400km range would only be able to travel about 70km. This may well not even be physically possible, if the engine is not powerful enough to run the electronic systems and move the vehicle adequately at the same time.
This would clearly render automation unviable from both an emissions and cost point of view. The CO2 and fuel consumption benefits forecast by the OVARE project would be wiped out, as too would the NOx benefits in all likelihood. If the global supply of energy were to increase to the point of cheap, surplus renewable (zero carbon) energy, the CO2 issue would theoretically disappear, although there may still be too little power on board to move the vehicle. Increases in data processing efficiency would reduce the energy requirement and may solve this power problem, as would reducing the amount of data transfer between vehicles and with the infrastructure. On the other hand, increasing requirements around data security and vehicle safety may lead to ever-increasing power demands.
One solution may be to develop processor chips better designed for this type of computation, and thereby more efficient. This could become a significant differentiator between producers, analogous to the differences in battery design. A further solution may be to restrict the domain of automation, accepting that autonomous driving may only be viable within certain situations or geographic locations, rather than covering every conceivable case.

This analysis does not attempt to evaluate the secondary effects of automation on traffic volumes. If automation proves to be an attractive consumer proposition, especially if it accelerates the trends away from some forms of public transport and towards private options, this could make congestion worse. Not only would this waste productive time, but would have the risk of making air quality worse due to legacy internal combustion engines being forced to drive in a more stop-start fashion, and higher tyre and brake wear emissions from all types of vehicle.
In short, the prospect offered by autonomous vehicles has been asserted by many to be “cleaner”, and this generally has been believed without in-depth scrutiny. As with tailpipe emissions, and as with battery electric vehicles, the message must be that independent, real-world data is vital to inform the debate and policy formation, to ensure that consumers and the market are not led down another avenue that in practice makes air quality or carbon emissions worse, often fertilised by large amounts of taxpayer money.
Nevertheless, we acknowledge the uncertainties in the above analysis and potential future efficiency improvements. We would welcome contributions of recent test data from OEMs or suppliers for a follow-up newsletter. However, if these findings even broadly reflect the reality, they could lead to a rapid reassessment of the realistic potential and timing of fully automated driving for passenger vehicles.
As a first step, it would be helpful to move beyond a narrative that uses ‘autonomous’ and ‘low emission’ as almost interchangeably good things. They are not. They more likely trade off against one another.
Nick Molden, Emissions Analytics, United Kingdom
Peter Striekwold, RDW, The Netherlands
Footnotes:
https://ec.europa.eu/growth/content/europe-move-commission-completes-its-agenda-safe-clean-and-connected-mobility_en
Su, K. (2017) IMPACTS OF AUTONOMOUS VEHICLES ON EMISSIONS AND FUEL CONSUMPTION IN URBAN AREAS. MSc Dissertation, Imperial College London, and Hu, S. Stettler, M.E.J., Angeloudis, P. Karamanis, R. Molden, N. (2017). Impact of vehicle automation on emissions and ride comfort. Microsimulation for Connected and Autonomous Vehicles Workshop, Loughborough UK, 2017.
https://www.osti.gov/biblio/1474470
https://hblankes.home.xs4all.nl/Oud/snelheid.htm
https://www.cbs.nl/-/media/_excel/2018/04/tabelvoorartikelrendementco2emissieelekrtriciteit2017.xls
260g of CO2 in gasoline or diesel with 1kWh of embedded energy, adjusted for 33% combustion efficiency
https://www.vpro.nl/programmas/tegenlicht/kijk/afleveringen/2018-2019/De-rijdende-robot.html
https://www.tuxera.com/blog/autonomous-cars-300-tb-of-data-per-year/
https://pdfs.semanticscholar.org/be83/e9a9a7e10a7f29a846fc54d62f08ebe9e884.pdf
https://onlinelibrary.wiley.com/doi/full/10.1111/jiec.12630

The Eclectic Highway podcast: The Fastest Route to CO2 Reduction
Listen to our Founder & CEO Nick Molden on Episode 4 of The Eclectic Highway podcast in a discussion with Kelly Senecal about the fastest route to CO2 reduction in transportation.

Our Founder & CEO Nick Molden was delighted to be invited on to Episode 4 of The Eclectic Highway podcast to take part in a discussion with Kelly Senecal about the fastest route to CO2 reduction in transportation.
Click below to hear the podcast:
You can also:
Listen on Apple
Listen on Spotify

Emissions Analytics Addresses Oxford Air Quality Meeting
Our Chief Executive, Nick Molden, is speaking at Keble College Oxford this Friday, 10th January 2020, at the Oxford Air Quality Meeting.

Our Chief Executive, Nick Molden, is speaking at Keble College Oxford this Friday, 10th January 2020, at the Oxford Air Quality Meeting.
The event has been established to draw together experts in vehicle emissions, air quality measurement, public health, and policy and features a key note speech from UK clean air champion, Professor Martin Williams of King’s College London.
Speaking at 11.30 am, Nick Molden will look at solving poor air quality quickly and fairly and how the consequences of ‘Dieselgate’ continue to cause market confusion at government, industry and customer levels.
The aim of the event is to facilitate interactions and discussions across a wide range of stake holders in the air quality field. Recent advances in real driving emissions measurement mean that greater understanding of roadside vehicle emissions is being developed. In addition, low cost air quality sensing and an increasing insight into how various pollutants effect humans mean that the evidence base is growing rapidly.
The Oxford Air Quality Meeting will bring together all of these groups, alongside policy makers to enable future improvements in air quality.
Those wishing to attend can register here
Plug-In Hybrids Without Behavioural Compliance Risk Failure
Tensions between official EU emissions policy and member states.
Tensions between official EU emissions policy and member states.
When the Worldwide Harmonised Light Vehicle Test Procedure (WLTP) commenced in September 2017, it replaced the New European Driving Cycle (NEDC) with a more realistic, ‘real-world’ approach to emissions testing. Following this switch, several models of plug-in hybrid car (PHEV) were withdrawn from sale in Europe as their emissions ‘rose’ sharply under the new test, disallowing them from various subsidies and benefits. Yet interestingly a wide range of new PHEVs are now being launched, two years later.
The new crop of PHEVs are likely to have been optimised to the WLTP emissions test, and come with larger batteries in the range of 10-30kWh instead of previously 3-6kWh. This ensures that they achieve super-credit status, or sub-50g CO2/km emissions ratings, which initially allows them to be counted twice in the fleet average CO2 calculation. This is vital for manufacturers who have to meet impending fleet average emissions targets of 95g/km from 2020 or face large fines in Europe.

This strong incentive from the EU level directly clashes with some member state policies: national governments that have cancelled generous subsidies for all PHEVs. This group of policy makers are suspicious of PHEVs.
The Dutch government, followed by the British, in late 2018, withdrew previously generous PHEV subsidies. They cited evidence suggesting that many owners, attracted by a subsidy, rarely plugged in their PHEVs.
So what is going on and who is right? If a PHEV is not plugged in, it typically drives around on a smaller than optimal internal combustion engine and achieves poor real-world results.
Of all PHEVs tested by Emissions Analytics, which includes petrol and diesel versions, the average performance in this condition is 37.2 mpg (7.6 l/100km) and CO2 emissions of 193.3g/km, which is 62.5% worse than the official NEDC results.
By no stretch of the imagination are these compelling figures if, as EU policy makers would claim, the purpose is to reduce real greenhouse gases as quickly as possible.
That is not to say that PHEVs have no claim to virtue. Their primary strength is offering electrification without range anxiety, since an internal combustion engine remains present, whether as a part of the drivetrain or as a ‘range-extending’ battery generator.
However, one of the challenges for PHEVs is that by the nature of the technology, their performance cannot be properly encapsulated and articulated by the standard, cycle-based rating. Rather, the real-world performance of PHEVs rests to an unusually large degree on user behaviour and journey length, rather than instantaneous combustion performance.
Research studies have shown that some duty cycles – for example commuting to and from work every day but charging overnight and avoiding long distances – can result in virtually no use of the ICE. The consumer has in this case had an EV ‘on the cheap’, without the weight and cost of a large battery pack. This is a PHEV at its best.1
At the other end of the spectrum, a PHEV might be deployed on long journeys and never plugged in. This results in a significant disbenefit, the vehicle typically offering worse fuel consumption and emissions than a conventional ICE-only drivetrain. This is a PHEV at its worst.
While we can recognise that many current or potential PHEV owners understand that the electric driving share of a PHEV, expressed as its utility factor (UF), is the key to its fuel economy rating and emissions, nonetheless the Dutch data, based on fuel card usage, included a significant business user fleet where there was evidently no fiscal incentive to save fuel. These owners were hardly plugging in.2
In the study referenced in footnote 1, based on 1831 Chevrolet Volts in the US, the authors found generally excellent utility factors, the average being 78%. In the Dutch data, which included smaller-battery PHEVs and owners who typically didn’t bother to plug in, the average utility factor was 24%.
If we take this spread, 24-78%, as the real range of utility factor, and return to the Emissions Analytics average PHEV performance of 193g/km CO2, it can be re-expressed as spanning 151g/km CO2 (24% UF), to 46g/km CO2 (78% UF).
The effect of the WLTP has been to force model overhauls, leading to larger internal combustion engines, and larger batteries to achieve longer electric range.
This is precisely what happened with the Mitsubishi Outlander PHEV, at different times and places the leading PHEV in Europe. To achieve a sub-50g/km result under WLTP the manufacturer fitted a 2.4 litre petrol engine, replacing a 2.0 litre unit, and increased battery size from 12kWh to 13.8kWh. EV range fell from 33 miles under the NEDC to 28 miles under the WLTP, but crucially it allowed the SUV to retain a sub-50g rating (46g/km) as a category 2 Ultra Low Emission Vehicle.
The warning to policy makers is that current and future PHEVs offer most of the same strengths and weaknesses of previous models, and that car makers are optimising their products to achieve the sub-50g result under WLTP but without guaranteeing any actual reduction in emissions.
In a very recent instance one OEM, Peugeot, boasted of an SUV featuring 4WD and 300hp yet 29g/km CO2, premised on an electric range of 36 miles and a 13.2kWh battery. The 3008 SUV GT Hybrid4 qualifies in the UK for the lowest Benefit in Kind (BIK) tax rating of 10%, re-attracting a subsidy.
In another 2019 product launch, the Volvo XC40 T5 Twin Engine claims 262hp and a preliminary WLTP rating of 38g/km. In this instance some but not all variants of this model offer a ‘hybrid’ setting that tries to optimise overall efficiency, except that whether it is deployed or not sits with the owner. Such an innovation is likely to confuse regulators and consumers alike, even if it may also work well in practice.

Our position is that on reasonable assumptions PHEVs will deliver less and less certain reductions in CO2 than non-plug-in hybrids. In other words, that they are ineffective without behavioural compliance, and that such compliance is politically infeasible in most democracies where it would be considered an intrusion on privacy.
The case for future PHEVs may lie principally in the light to medium commercial fleet, where the advent of zero-emission city centres may force dual-drivetrain approaches, the pure electric drive share being saved for last mile delivery and the ICE (diesel as well as petrol) permitting long highway distances, refrigeration units and so forth.
Geo-fencing is also strongly foreshadowed in current fleet management, from public bus fleets to Uber’s app, and suggests a straightforward way to ‘enforce’ the correct use of a PHEV, thus compelling fleet operators to plug them in.
This would go a long way to addressing the ongoing weakness of the PHEV, its drivetrain sleight-of-hand that courts generous tax-payer subsidy but delivers poor real-world performance.
In the realm of private passenger cars, however, we have shown in a previous newsletter how by comparison non-plug-in, full hybrids offer much faster and more certain emissions reductions of up to 30%. Given the importance of reducing CO2 emissions agressively and quickly, the lower risk option may be preferable.
1 Patrick Plotz, Simon Arpad Funke, Patrick Jochem. ‘The impact of daily and annual driving on fuel economy and CO2 emissions of plug-in hybrid electric vehicles’ in Transportation Research Part A, 118 (2018) 331-340.
2 Ligterink, N.E., Eijk, A.R.A, 2014. ‘Update Analysis of real-world fuel consumption of business passenger cars based on Travelcard Nederland fuelpass data’, TNO Report TNO 2014 R11063.

The Promise Of Life Cycle Assessment And Its Limits
Approaches to comparative rating of vehicles.
Approaches to comparative rating of vehicles.
Life Cycle Assessment (LCA) is the principal way to achieve clarity over the environmental credentials of varying drivetrains, and may become the basis of primary legislation in Europe and beyond over the next decade.
The purpose of this newsletter is to consider how LCA can work in practice, bringing clarity to the automotive sector both as an efficient market, the producer of environmentally sensitive products and in respect of consumer choice, i.e. how vehicles might be rated and ranked for their ‘greenness’.

LCA has existed as a concept since the 1970s and is by now a well-established field of academic inquiry. Contrary to common perception in 2019, LCA is not necessarily about CO2 emissions and the climate ‘friendliness’ of one car over another, say diesel versus electric. LCA can equally apply to other impact categories such as social justice or supply chain efficiency, and indeed ‘non-climate’ environmental impact categories such as water use. It is a method for considering the total lifespan of a product, but the chosen theme and system boundaries can be many, and they can be divergent. It can be applied to any product and not just cars. Owing to their material and commercial complexity, cars are among the most challenging products to apply LCA to.
A useful historical note is to remember that a precursor of LCA was Technology Assessment (TA) in the US in the 1960s. The aim of this nascent philosophy was to brief Congress on the likely impact on society and economy of new technologies, to inform intelligent policy decisions.
LCA offers a not dissimilar service today. Conventionally, it relies on a modelling of a vehicle’s impact in four areas: fuel (from source to distribution); vehicle production, vehicle use and end-of-life.
Until recently the greatest emphasis was on the fuel because the use-phase of an internal combustion engine vehicle (ICEV) is the dominant source of emissions. With electrification, the emphasis has swung to vehicle production (batteries) and end-of-life (batteries), both about which there remains a lack of usable data. There is no utility scale automotive battery recycling, but it takes place on a small scale. Meanwhile, the estimate of embedded emissions from manufacture as a proportion of total emissions are 15-20% for a gasoline car, but 20-60% for a battery electric car. Recent studies have emphasised the larger figure in that wide range, citing not just the batteries but supporting, high emission components such as aluminium. Meanwhile the fuel question is displaced to the energy grid and looms large in any credible assessment of the environmental claims of EVs.
LCA also casts doubt on the industry’s claim that diesel is better than gasoline in climate terms. In fact a diesel car’s embedded emissions are higher than a gasoline car’s (the range of estimates is 20-30% versus 15-20%, respectively) thanks to the heavier engine block and typically greater emissions controls. Like an electric car it then has to ‘break even’ over its lifetime by offering lower in-use CO2 emissions.
It is worth noting that the academic field of LCA has already moved somewhat beyond these basic LCA applications even though they remain in their infancy and are not typically understood or applied by policy makers, consumers or even parts of the car industry. Current LCA trends are to move beyond product life cycles to consider user patterns and behavioural dimensions.
Rebound effects suffice here as a cautionary note. If a consumer saves fuel costs by buying an electric car, but spends the proceeds on a long-haul flight to the Caribbean, that’s a negative environmental rebound effect. Such whole system thinking demonstrates that beyond the application of LCA to cars there remain wider considerations, including the very desirability of private car ownership given projected global urbanisation rates, resource scarcity and the political imperative towards liveable cities.

Despite all such concerns, the advent of variously electrified drivetrains makes an LCA approach essential, in our view, for the achievement of basic consumer clarity around product claims as well as policy maker insight.
One central objective, echoing previous Emissions Analytics newsletters, is achieving the greatest reduction of CO2 emissions in the shortest possible time, in the real world and not just on paper, so as to achieve the promise of the Paris climate accord and the stated goals of the IPCC in containing climate change.
Unfortunately, almost all existing vehicle regulation in OECD countries is out of sync with this climate objective, having arisen in an era in which the internal combustion engine was overwhelmingly dominant. Existing regulation concerns fuel economy and tailpipe emissions. Because EVs have tank-to-wheel emissions of zero, they have caught the policy-makers’ ear for being ‘zero emission’. Partly as a result, numerous countries have now declared their intention to halt the sale of ICE drivetrain vehicles in coming decades.
Our view of this development is one of caution, partly because of the insight afforded by the application of LCA.
In short, countries such as the UK, India, France and China are moving towards outright bans on internal combustion engines before regulators have established even rudimentary frameworks for lifecycle carbon emissions of vehicles.
It is not widely understood in the West that China’s push into rapid electrification is primarily to address poor air quality rather than combat climate change. In LCA terms its electric cars are at best roughly on par with their ICEV equivalents, with small gains predicted by 2020.[1]
This helps to explain why one of the themes of 2019 has been a series of reports identifying the high upfront embedded emissions in electric cars and the perils of grids not yet weaned off coal and lignite.
Bloomberg NEF, with Berylls Strategy Advisors, recently claimed that by 2021, ‘capacity will exist to build batteries for more than 10 million cars running on 60 kilowatt-hour packs’, with ‘…most supply … from places like China, Thailand, Germany and Poland that rely on non-renewable sources like coal for electricity.’[2]
Modelling the climate emissions of the manufacture of these batteries led the analysts to claim that the 500kg + battery pack for an SUV emits up to 74 percent more CO2 than producing an efficient conventional car if it’s made in a factory powered by fossil fuels in a place like Germany.
Several other similar reports in 2019 have pinpointed the environmental achilles heel of electric cars – their batteries – some pointing out not just their manufacturing emissions but to other impact categories relating to the mining of battery materials at scale. In some of these reports the claim is that electric cars can be dirtier than diesel cars on an LCA basis, under certain scenarios.
At the opposite end of the spectrum, critics of these reports have been up front in admitting that fulfilling the promise of clean transportation rests on decarbonising the wider energy grid, both in respect of EV manufacturing and EV use-phase. The true potential of electric cars therefore lies in the future.[3]
[1] ‘Life cycle greenhouse gas emission reduction potential of battery electric vehicle’. Zhixin Wu, Michael Wang, Jihu Zheng, Xin Sun, Mingnan Zhao, Xue Wang. Journal of Cleaner Production 190 (2018) p462-470.
[2] www-bloomberg-com.cdn.ampproject.org/c/s/www.bloomberg.com/amp/news/articles/ 2018-10-16/the-dirt-on-clean-electric-cars; Berylls Strategy Advisors, www.berylls.com.
[3] ‘The Underestimated Potential of Battery Electric Vehicles to Reduce Emissions.’ Auke Hoekstra, Joule 3, 1404-1414, June 19, 2019.

Broadly expressed, we acknowledge elements from both sides of this debate and incorporate them in the preparation of individual vehicle assessment. The lowest GHG emission is from hydropower and on this basis an EV in Sweden, as early as 2010, emitted just 6g CO2/km in use; the highest GHG is from lignite and produces an equivalent figure of 353g CO2/km.[1] The authors of this respected academic paper consider that with the current EU grid mix, the emissions of BEVs are between 197 and 206g CO2-equivalent/km, depending on battery chemistry.
At this juncture it is important to emphasise the very promising middle ground occupying the space between ICEV and BEV, the land of the hybrid and plug-in hybrid. In many situations a part-electrified drivetrain can outperform both ICE and BEV owing to the very high embedded emissions in the BEV and its underperformance in cold weather and/or when fuelled from a fossil heavy grid.
In this observation we have in mind one particular paper breaking down drivetrain performance by US regions. The ICE drivetrain had the worst GHG emissions in almost all scenarios, demonstrating the imperative of electrification for climate mitigation in a broad sense; but where cold weather and part-coal grids came into play (typically in parts of the Midwest) the worst performer overall was a BEV, while in all regions the best performing drivetrains were hybrids and plug-in hybrids, partly owing to their ability to scavenge waste heat from an ICE to operate the HVAC system in low temperatures.[2]
As such our default position is technology neutrality respecting acknowledged unknowns. Whereas some reports have claimed that in-use battery degradation could add as much as 29% to the real emissions of a medium size BEV over its life, other studies have noted that the existing durability of batteries in some hybrids suggest that the industry assumption of a lifetime of 150,000km or 8 years (the ‘functional unit’ in LCA language), is excessively cautious, with some early hybrids achieving multiples of this. The truth is that we don’t know because there is not yet enough real-world data to draw on for real-world results.
Where Emissions Analytics will contribute is by modelling an LCA approach premised on the use-phase emissions attained through real-world testing, allowing for a rising scale of other inputs that permit worst-through-best scenarios instead of being captive to a particular model or paradigm.
As things stand there is an emergent consensus view that BEVs can potentially be 30-50% better in GHG emissions, in a whole life LCA perspective, with extensive renewables at manufacturing and in-use, but this is certainly not invariably so.[3] For now, deeming EVs as the cleanest simply by virtue of what they are is misleading.
It’s equally important to note in passing that while climate considerations have become imperative, electrification is something of a devil’s bargain owing to other environmental impact categories that remain far worse than for ICEVs no matter how far projected into a golden future – these include terrestrial acidification; freshwater eutrophication; human toxicity and non-exhaust particulate emissions.[4]
Discrimination by battery origin and market of operation will quickly become an important consideration, and forms the underlying basis of Emissions Analytics’ approach to a ratings model for vehicles.
The other emerging theme is the importance of the duty cycle. The emissions ‘breakeven’ potential of an EV rests on its mileage. It may well be that a small hybrid car remains in LCA terms much more efficient for the occasional or low mileage driver than a full EV.
These and other themes will emerge rapidly as an LCA approach comes to dominate thinking and the regulatory environment. Communicating ratings to car buyers in a comprehensible way will remain Emissions Analytics' mission.
[1] ‘Environmental life cycle assessment of electric vehicles in Poland and the Czech Republic.’ Dorota Burchart-Korol, Simona Jursova, Piotr Folega, Jerzy Korol, Pavlina Pustejovska, Agata Blaut. Journal of Cleaner Production 202 (2018) 476-487, p485.
[2] ‘Effect of regional grid mix, driving patterns and climate on the comparative carbon footprint of gasoline and plug-in electric vehicles in the United States.’ Tugce Yuksel, Mili-Ann M Tamayao, Chris Hendrickson, Inêz M L Azevedo and Jeremy J Michalek, Environ. Res. Lett. 11 (2016) 044007, p8.
[3] This was the finding of BMW in its LCA for the BMW i3 BEV, conducted according to ISO 14040/44 and independently certified in October 2013. The 30% figure assumed the EU-27 grid mix, while the 50% figure assumed 100% renewables. In this study almost 60% of the vehicle’s GHG footprint resulted from manufacturing despite enormous efforts of the company to source renewable energy for production, including all carbon fibre production and the use of re-cycled aluminium.
[4] ‘Environmental life cycle assessment of electric vehicles in Poland and the Czech Republic.’ Dorota Burchart-Korol, Simona Jursova, Piotr Folega, Jerzy Korol, Pavlina Pustejovska, Agata Blaut. Journal of Cleaner Production 202 (2018) 476-487. See Table 9 on p484.

Mayor delivers online checker to help car buyers choose less polluting new vehicles
Mayor delivers online checker to help car buyers choose less polluting new vehicles. Read the press release here.


Are diesels done for?
As the government loses a second high court ruling brought by ClientEarth, many are now sounding the death knell for diesel cars. Not so fast, says Emissions Analytics, diesels can be clean and govenments are highly unlikely to give up the greenhouse gas advantage of diesel in the short- or medium-term.
As the government loses a second high court ruling brought by ClientEarth, many are now sounding the death knell for diesel cars. Not so fast, says Emissions Analytics, diesels can be clean and govenments are highly unlikely to give up the greenhouse gas advantage of diesel in the short- or medium-term.
Since the introduction of Euro 6 in September 2014, manufacturers have been forced to improve their after-treatment systems to meet the stricter legislated limits for NOx. Exhaust Gas Recirculation, Lean NOx Traps, and Selective Catalytic Reduction technologies have been employed as part of a complex strategy to reduce tailpipe emissions. There have been variable successes, with some achieving the regulated limits even in real-world driving and the worst more than 20 times the legal limit. Overall, average NOx emissions from Euro 6 diesels are down 55% compared to Euro 5s.
Nonetheless, there is still the fact that many new cars do not meet the legislated limits in real-world operation. Our data shows NOx emissions are on average 4.3 times over the limit for Euro 6 cars and, after a period of improvement, this Conformity Factor is rising. This is the heart of the issue, as to whether diesels are the major and unavoidable cause of poor air quality in towns and cities.
Consequently, there have been many suggestions made to combat the problem of dirty diesels. These range from the London Mayor’s T-charge, to a diesel scrappage scheme, to a total ban on diesel vehicles in certain zones. However, Emissions Analytics’ data shows that modern diesels in their own right can be clean.
Since the launch of the EQUA Air Quality Index six months ago, twelve cars have how achieved an A-rating including the latest Volkswagen Tiguan, meaning it has met the 0.08g/km limit in real-world driving.

This proves that diesels can be clean and the reason most are not is down to a failure of regulation and enforcement and not the technical impossibility.
There is also the issue of CO2 emissions to be considered. Despite Donald Trump tweeting that climate change was, “created by and for the Chinese in order to make U.S. manufacturing non-competitive,” the British government has an empirical view on global warming and stands by its commitment to cutting its carbon footprint. Would ministers give away the 16% CO2 advantage – according to Emissions Analytics’ testing – diesel has over gasoline for the same distance driven in real-world operation, until there is a viable alternative.
In the future electric and hybrid vehicles may deliver the CO2 advantage required, as well as greatly reducing, or eliminating, NOx and other harmful emissions, at which point diesel powered engines for passenger cars may come to the end of the road. However, with a share of the market of less than 2%, there is still a way to go for these vehicles. Until then, Emissions Analytics’ data strongly suggests the policy focus should be on sorting the clean from the dirty diesels and incentivising manufacturers to bring forward clean technology.
The latest EQUA Aq Index results are available online
Archive
- AIR Alliance 3
- Air Quality 38
- Audio 3
- Climate Change 14
- EQUA Index 21
- Electrified Vehicles 28
- Euro 7 3
- Fuel Consumption/Economy 20
- Fuels 4
- Infographic 18
- Media 4
- NRMM/Off-road 3
- Newsletter 103
- Podcast 7
- Presentation/Webinar 18
- Press Release 19
- Regulation 16
- Reports 4
- Tailpipe Emissions 49
- Tyre Consortium 2
- Tyre Emissions 26
- Vehicle Interior 6