

Grand theft auto?
No-one seriously doubts manmade climate change, and there is more of a scientific consensus on the range of likely effects than some of the more lurid headlines would suggest. The cost of the impacts is reasonably clear. To solve climate change, the technology options are also fairly clear and well costed. There is also consensus that we need to invest now in the solutions, even if there is some disagreement as to the total net cost over time. Why, then, is it all proving so hard to see through?
Why we are not solving climate change
No-one seriously doubts manmade climate change, and there is more of a scientific consensus on the range of likely effects than some of the more lurid headlines would suggest. The cost of the impacts is reasonably clear. To solve climate change, the technology options are also fairly clear and well costed. There is also consensus that we need to invest now in the solutions, even if there is some disagreement as to the total net cost over time.
Why, then, is it all proving so hard to see through?

We sit here around the societal dinner table shouting at each other, rather than genuinely discussing, listening and trying to understand each other. The carnivorous fossil fuel industry goads the vegan environmentalist, who moralises back, while trying to ignore the side-order of climate-denial fruit.
The simplistic answer to why this is proving a hard problem to solve is that there are powerful incumbent interests in fossil energy production and associated industries. That is not news, although it is an inescapable fact. We are stuck because we are trying to dislodge the vested interests in a way that is unlikely to work. We are attempting property appropriation, when we actually need to cut a deal. We are not on the brink of a political revolution because consumers remain quite happy with their cheap fossil fuels. Therefore, we need to address the preeminent position of the fossil fuel industry within our social contract, within agreed property rights and with the consent of all sides. After all, society needs industry for its security and quality of life, just as industry needs social acceptability.
If you think the accusation of property appropriation is far-fetched, consider this. Cars are a perfectly legal product for consumers to buy and use around the world, but in Europe, in particular, there have been progressively tightening constraints on when, where and how they can be used. Rules start sensibly, for example with speed limits and highway codes – the safety benefits outweighing the constraint on personal liberty. Access controls or pricing may deliver urban air quality benefits that society values. Then we get to blanket access prohibitions, technology bans, SUV-shaming and so on. For producers, who have equally been trading cars quite legally, they find technologies in which they have internationally competitive intellectual property (for example, internal combustion engines) banned, or assets they have developed (for example, oil fields) become stranded. It is reported that the European Union (EU) may even ban car rental firms and large companies from buying anything but electric vehicles from 2030.
To any pragmatic reader, the best answer is clearly to strike a midpoint that balances societal costs and benefits. All sides could probably agree on this, although sub-arguments would undoubtedly run as to where exactly that midpoint was. In practice what is happening is that each side is competing to extremes: net ZERO, vision ZERO, and so on. This is such a mistake as bads (such as pollution) tend to exist as by-products of goods (mobility). The only way to zero bads is zero goods. So, it is no wonder that the two sides cannot come together and just shout at each other, in a binary struggle for survival.
By virtue of their strong incumbent position, the fossil fuel industry can afford to take a cautious position on any significant changes. To try and dislodge these entrenched interests, the following playbook is often employed by opposing interest groups:
1. Highlight something undesirable (climate change, road safety), and make it an “emergency”
2. Set a target of zero for the undesirable thing
3. Make it a moral/existential crusade
4. Pick the winning solution
5. Pay “independent” organisations to lobby for your choice
6. Recruit followers and evangelists to pursue a grassroots campaign
7. Impugn the motives of anyone who disagrees with you.
Of the many questionable tactics, it is possibly stage two that is the most damaging. If you require zero bads then you ask for a de facto ban. You are appropriating physical and intellectual property. The constraint on free behaviour is not in proportion with the damage caused by the bad. Some car manufacturers promulgate the idea of zero fatalities from driving. As preventing those last few accidents will be so disproportionately expensive, it effectively makes cars infinitely expensive. A de facto ban. For society, undoubtedly an undesirable outcome.

The EU is undertaking a more direct form of property appropriation, but it also sits within the broader theme of net zero. It legislated recently to force car owners to scrap their vehicles when significant repairs are needed. Classic cars – typically valuable – are excluded but roadworthy older cars that deliver solid motoring but that are worth little in the market are highly vulnerable. We wrote about this “end-of-life” vehicle regulation when originally promulgated, in Kohlendämmerung.
Recent legislative discussions have made the proposal less troubling on the surface of it, but more troubling in the detail. Rather than being forced to scrap a vehicle at the point of repair, it only applies if selling the car, at which point proof of roadworthiness would be needed. In addition, sales between private individuals are excluded from the requirement. For vehicles being sold by or to a dealer, or via an online platform, a roadworthiness certificate would be required. Where a vehicle was in need of repair, showed excessive wear or had leaking fluids, an independent expert would need to be commissioned to opine on whether the vehicle was at the end of its life. At the end of life, the owner would need to deliver the vehicle to a special facility and obtain a certificate of destruction. As roughly half of vehicles in Europe are transacted commercially, rather than privately, this can be seen as a material transfer of value – in terms of expert fees – away from the vehicle owner, although you could always circumvent this by selling your car privately. Nevertheless, there would be inevitable diminution in vehicle value.
So, on the surface, the proposal has been made more acceptable and truer to the objective of avoiding exporting dud cars and aiding resource circularity. However, worrying terms hide in the details. It leaves it to Member States of the EU how strictly to implement the criteria listed in Part B of Annex I [of “Proposal for a Regulation of the European Parliament and of the Council on circularity requirements for vehicle design and on management of end-of-life vehicles, amending Regulations (EU) 2018/858 and 2019/1020 and repealing Directives 2000/53/EC and 2005/64/EC.”] A country could take a pure and extreme interpretation of the “criteria to be assessed.” Worse, the European Commission can rewrite the criteria whenever it likes, without democratic safeguard:
In order to take into account technical and scientific progress, the power to adopt acts in accordance with Article 290 of the Treaty on the Functioning of the European Union should be delegated to the Commission in respect of amending Annex I determining the criteria on when a vehicle is end-of-life vehicle.
If the sales of battery electric vehicles lag the key 2035 targets, what is there to stop the end-of-life rules being tightened both to put consumers off buying the last generation of internal combustion engine vehicles at the same time as pushing more existing vehicles off the road?
It is quite striking how far down the road of property appropriation we have already been led, but it has of course been done sliver after slice. Even so, it is not sufficient to criticise unless a viable alternative to solving climate change can be offered – but there is. As we have shown, aiming for zero bad entails banning the good. It’s going too far. Just to eke out that last benefit comes at a huge cost. The optimal point is, much more plausibly, the point at which the benefit increase equals the cost of achieving. This can only be practically achieved by putting a price, by some mechanism, on the pollution. In this vein, credit should be given to the EU for progress made so far on putting a price on carbon, although there is a long way to go to make the system broad enough in application to be effective.

For cars, there is fortunately a solution at hand, as detailed in a recent book by Professor Felix Leach and Nick Molden called Critical Mass – the one thing you need to know about green cars. As most unabated pollutants correlate well with car weight, if vehicle taxation were changed to be based exclusively on this factor, a price of pollution would effectively be established. No bans. No property appropriated. Just the driver paying the right price for the pollution created. The driver will adapt behaviour according to the price, and generate tax revenues to fund wider societal goods. As an aside, it is paradoxical that many who oppose such pricing approaches are strong advocates for dynamic pricing of electricity for electric cars.
To work out where you on the appropriation-pricing spectrum, ask yourself what the correct question is. Is it How do we limit driving? or is it How do we limit climate change?. The latter is the right question. If you plump for the former, you are using climate change to pursue a separate, car-restricting idea. And if you are plumping for the former, you will be much more disposed towards property appropriation. This polarity appears in another incarnation very often: How do we push electric cars? in contrast to How do we decarbonise transport?. They are not the same thing, and if you put the first question as the primary one, you are more interested in promoting electric cars than you are cleaning up transport.
Which brings us to the deal to be done to solve the problem of vested fossil fuel interests. Much as we might object to the pollution their products lead to, these companies have created legitimate, legal assets. Moving forward, their products should pay the true price of the pollution created, which is relatively uncontroversial, and is practical as described above. But this will still reduce the value of their assets, and, to get them to accept this, a level of compensation will be required. Not full compensation, though, as supporting decarbonisation will give them renewed societal legitimacy. Just as when the National Health Service was founded in the UK, the doctors were paid handsomely to forego their endowed interests to build a new public healthcare system. Just as when European slave owners were compensated for the loss of their labour to build a more equal society. This may be distasteful, but if an endowment is legally obtained, appropriating it will not work. This is also distinct from vexed discussion of compensation for past injustices, whether that is climate reparations, through first nation peoples, to the 245 cattle given to the Maasai for culturally sensitive artefacts in Oxford. Rather, we are talking about a conscious deal to allow progress.

In summary, then, we are not achieving our climate change goals because we have postulated zero as the desirable goal, have stirred up moral panic and are heading down the road of property appropriation. This will not work, not least because so many people have their pensions invested in industrial incumbents. There is a useful contrast with how so much progress has been made improving urban air pollution. Zero pollution has never been suggested, solutions have been carefully calibrated to balance societal benefit against cost, incumbent industry has been part of the solution, morals have largely been kept out of it, and air quality is much improved on just ten years ago. We need to apply this urgently to climate change. If it means net-minus-80% carbon dioxde and everyone plays their part in the solution, we will be a lot better off than now.
Yet it is so tempting for each of us to the decide the “right” solution and – due to the vital important of the topic – force this answer on others as a moral rather than objective imperative. Jean-Jacques Rousseau, the French philosopher writing in 1762, believed that people, when acting rationally and considering the common good, would naturally choose to obey laws that promote the overall well-being of society. Forcing someone to adhere to such laws is, therefore, simply helping them realise their true, rational will. In the famous phrase, they should be “forced to be free.” This is very much the theme and philosophy of European governments right now. It is not so different from how Stalin and Mao sought “moral improvement” of their people. This is a slope, and a dangerous one if you choose to go down it.
So, we have a choice between an unpalatable deal and a dangerous challenge to liberty. Put another way: the combustion car is under threat of being outlawed in order to dislodge fossil fuel interests. The economic, geopolitical and social damage from this may be much greater than a pragmatic deal, and may just hand the economic rent enjoyed by fossil industries straight to a different set of equally uncontrollable industrial and political interests.
Chose thoughfully, and be careful what you wish for.

The most complex suicide note in history?
The 1983 UK General Election saw the Labour Party manifesto dubbed the longest suicide note in history. The current policy for decarbonising transport in the UK and Europe may be the most complex one. For the policy to work, it is necessary simultaneously to switch the grid to green sources and fundamentally change the relationship between consumers and their cars, in order to balance that new grid. Both are a major challenge, and if either fails, the whole policy fails. If it does go off plan, we may well end up with undesirable cars being powered by a dirty grid, and an unresolved climate change problem. Are industry and government locked in a suicide pact?
Vehicle emissions and grid decarbonisation
The 1983 UK General Election saw the Labour Party manifesto dubbed the longest suicide note in history. The current policy for decarbonising transport in the UK and Europe may be the most complex one. For the policy to work, it is necessary simultaneously to switch the grid to green sources and fundamentally change the relationship between consumers and their cars, in order to balance that new grid. Both are a major challenge, and if either fails, the whole policy fails. If it does go off plan, we may well end up with undesirable cars being powered by a dirty grid, and an unresolved climate change problem. Are industry and government locked in a suicide pact?
We are not used to living in age of electricity rationing, but this is a real prospect as we try to clean our grid with a big switch to renewable energy sources. The UK is already flirting with using its contingencies, even on the existing less intermittent grid, with fewer electric cars and data centres – although at no point so far has the grid come close to shutting down. On 3 December 2024, headroom was nearly eliminated such that a call for rapid reaction contingencies was initiated. On 8 January 2025, power had to be called from Norway to preserve headroom. These are just the first inklings of a problem, and one that applies to many European countries, not just the UK.
The underlying challenge is that we are trying to expand grid capacity to meet rising demand, while at the same time decarbonising it. The chosen primary route to decarbonisation is renewables – specifically wind and solar. These sources have two limitations. First, as they are intermittent, they need accompanying storage to save the surplus peak energy and release it during dark or windless hours. Second, they have relatively low “capacity factors” – the ratio of actual electricity generated in practice compared to the theoretical maximum. Therefore, it is necessary to “oversize” the installed capacity to generate the same electricity as traditional energy sources. Together, to make this approach work, it is necessary to install significant amounts of wind, solar and storage.
The UK’s National Energy System Operator (NESO), which runs the electricity grid, has published a number of scenarios for electricity demand and supply through to 2050, in the context of aiming for net zero . As a measure of the tightness of supply in 2050, even though the installed capacity of wind is forecast to increase by a factor of five and solar by a factor of six compared to 2023, this is not enough to switch off traditional fossil fuel production. Nuclear is also forecast to increase almost four-fold (which would be great for emissions reduction, but would need enormous commitment to achieve), and interconnections to other countries almost three-fold. Still, not enough.

To fulfil the projected 146% increase in annual electricity demand, the vehicle fleet is expected to contribute in two new ways: “demand management” and “vehicle-to-grid storage.” Demand management and its “smart pricing” seek to shift demand to times when there is surplus renewable power. Vehicle-to-grid (V2G) or bi-directional charging allows the grid to suck energy out of your car when the grid needs it. In other words, you will be constrained in when you can afford to charge up, and you might find a lack of charge in your car for your journey. If, for example, only 20% of cars are plugged in at the crucial time, those connected could lose 3 kWh each hour based on NESO projections. Of forecast peak capacity in 2050 of 119 GW, smart pricing reduces demand by 12 GW and V2G could provide 20 GW of power. Therefore, the vehicle fleet is expected to contribute 27% of peak demand to make the numbers add up. This comes at the cost of constraining personal freedom and the inherent attraction of the motor car. On most days, it will be fine, but consider those dark, still, winter Dunkelflaunten when your car will be an expensive brick. This will reduce the utility of a car, and so the willingness of consumers to pay. Fewer cars will be sold, at lower prices, with damage to the industry and personal welfare.
Some, however, would say that such an outcome would be good if it reduces demand for private motoring and leads to a shift to public transport. The bigger problem that remains is that, even with demand management and V2G storage, grid capacity might still fall well short of growing demand. Of the 116 GW of installed capacity in 2023, 36% of this is to be shut down to meet net zero – primary gas and biomass sources. If we take NESO’s “Electric Engagement” scenario where almost the whole fleet is electrified by 2050, 386 GW of installed capacity is needed. In other words, the “clean” part of the grid in 2023 would need to be increased more than five-fold by 2050. 344 GW of new capacity would need be installed that did not exist in 2023. Just 19% of the forecast grid in 2050 was already in place in 2023. Although the UK in particular has made good progress in decarbonising its grid so far, future infrastructure requirements for 2050 are large and risky. If, for example, we fall 25% short of the target for new build-out, it would leave a supply gap of 68 GW in 2050.
At the same time as we face the risk of falling short on supply, demand could rise more quickly than expected. This is not just speculation, as the question is being forced on us by a seismic change since the vehicle electrification policy was enacted: Artificial Intelligence (AI) is taking off in a way that exceeds the expectations of most. As a result, the well-understood increase in electricity demand needed to support a BEV fleet (around 28 GW in 2050 with unmanaged demand) has now been joined by rapidly growing – and somewhat unpredictable – demand from AI. Just one example, as reported in The Guardian recently, is an application submitted for a new data centre in the UK that would “…cause more greenhouse gas emissions than five international airports.” It is forecast to consume 3.7 bn kWh [3.7 TWh] of energy per year when running flat-out, releasing 857,254 tonnes of carbon dioxide (CO2), based on the current average grid mix.
The same NESO scenario as above assumes electricity demand from data centres to be 54 TWh in 2050. One of the more bullish forecasts is from the BloombergNEF, at 3,700 TWh globally. As the UK is approximately 3% of global GDP, that would imply 111 TWh in the UK. This would reflect 39% of 2023 demand and 16% of forecast demand in 2050. If correct, this would create 57 TWh, or almost 7 GW running constantly, of extra demand on top of the Electric Engagement scenario forecast. For comparison, Wood Mackenzie, a consultancy, is already tracking 134 GW of new data centres in the US, which would be 17 GW if pro-rated to the size of the UK. The BloombergNEF projection may, therefore, turn out to be cautious.
So, we can see that persuading customers to buy BEVs is only part of the challenge. Even if we electrify everything, our demand forecasts must be accurate, supply capacity build must happen, and car owners must be willing to engage with behavioural change. If these conditions are not met, we may not have the capacity necessary to meet demand. On plausible scenarios we could be at least 75 GW short, or 19% of the forecast installed capacity in 2050. In this case, what would happen?
The first instinct would be to “manage” demand further. The 75 GW shortfall assumes the maximum use of vehicle smart charging, so that is not an option. Authorities could move to a harder rationing of electricity for motor vehicles, which would be possible by restricting use of public chargers and more aggressive use of V2G storage capacity. It is likely that authorities would prefer to limit motor vehicle use than home heating or electricity, or industrial activities. With remote working now commonplace, driving would be the first activity to be cut, for all but essential purposes. The alternative would be to keep fossil fuel power generation going for longer, which would be politically highly embarrassing.
Despite the embarrassment, it is possible that governments may keep fossil power stations so people could keep driving. In this case, it would be fair to see vehicles as powered by marginal, “dirty” electricity. At present, the marginal CO2 per kilowatt-hour (kWh) of electricity is 350 in the UK, compared to an average carbon intensity of 124 g/kWh. So, almost three times dirtier at the margin. The European Union (EU) marginal rate is around 550 g/kWh, compared to an average of 244 g/kWh. In Poland, the values rise to 880 and 662 g/kWh respectively. This illustrates that the cleaner the average grid becomes, the greater the proportionate uplift at the margin is likely to be. It is worth noting that France’s current grid carbon intensity is 24 g/kWh on average but 510 g/kWh at the margin; even 18 nuclear power plants with 57 reactors is not always enough.
In future, the carbon intensity of the grid at the margin is likely to remain similar to today, at 350 g/kWh. Applying Emissions Analytics’ own real-world testing and decarbonisation modelling, we see the following. The second column covers all the up- and down-stream carbon in making and ultimately disposing of a vehicle, and liquid fuel production. The second column covers the tailpipe CO2 and the same emissions from electricity generation. Each powertrain/grid combination can then be compared over the life of a car compared to the gasoline ICE baseline.

The “average grid” scenario reflects the situation today, where there is sufficient grid capacity to power the new BEVs, but the sources of energy are mixed, including significant fossil fuel gas. The “marginal grid” scenario is similar to NESO’s Electric Engagement scenario, but where capacity growth falls materially short, vehicle-to-grid does not work, or demand growth is even greater than expected. In other words, the new BEVs are being powered entirely by the marginal, fossil fuel energy.
On the current grid mix, BEVs already reduce lifecycle CO2 by 49%, whereas in the EU it is only 32%. In the worst case scenario, having invested so much in electrifying the fleet, the UK might find only a 16% reduction in CO2 emissions. The EU could be in any even worse position, with CO2 rising by 13%, although this is unlikely to happen as the current marginal sources derived from coal would likely have been replaced by gas by 2050.
Which leaves an interesting dilemma. If we push ahead with a best case scenario that gives 85% CO2 reduction thanks to a clean grid, but we fail to make the grid work or demand soars unexpectedly, we could easily end up in a scenario that would be worse than the low risk option of converting the fleet first to plugless full hybrids, which would allow us to bank 29% CO2 reduction quickly and for low cost. Put another way: if we want to convert the fleet to all-electric by 2050, we must be certain that the grid can accommodate such a fleet cleanly.
The optimal strategy, we would suggest, is to push for hybridisation of the fleet simultaneously with grid decarbonisation, and only push on to fully electrified vehicles when the clean grid capacity is secure. This would be a more robust mix of risk and outcome. It would not meet net zero by 2050, but it would reduce delivery risk, and reduce CO2 more quickly in the early years by avoiding the high manufacturing emissions caused by largescale battery production. As readers of many previous newsletters will recall, Emissions Analytics believes that the data points to hybrids – especially full hybrids, with a decent battery size but no plug – being the best way to decarbonise transport for the next decade. After that, fostering technology-neutral competition between rival technologies would be optimal. During the coming decade, investment should be sharply focused on decarbonising the electricity grid, rather than subsidising well-off people to buy expensive (and heavy) pure electric cars.

If we mess this up, we might yet end up living the joke of having to charge up our electric vehicles with a diesel generator. (The AI-generated image above probably cost us 5 grams of CO2 emissions…) Having just recovered from a recent visit to an unnamed low carbon vehicle show that involved entering through unmistakable clouds of diesel fumes from the backup generators running the stands, this is clearly undesirable. At Emissions Analytics’ most recent conference, called Off-Highway Powertrain & Fuels and which we hosted in Chicago, a session stood about these static power sources. Demand is soaring for utility-scale, diesel-fuelled generators, most notably to power data centres to fulfil the already-voracious appetite AI systems have for energy.
Has the suicide note already been signed?
Postscript
We have taken a largely UK and European perspective in this newsletter, but similar arguments are playing out in the USA. For an insightful read from that perspective, we would recommend the article U.S. Energy Policy Undercuts EVs to Make Way for AI by Tammy Klein published recently in Transport Energy Strategies.

Critical Mass 4: The Politics - Molden & Schmidt Episode 15
We've heard about the big idea - taxing cars by weight and mileage, not engine type. We've looked at the science, the money, and the practicalities? But what about the politics? What could persuade governments to revolutionise the vehicle taxation system? How could this concept overcome the scepticism of the press, public, and politicians who don't like meddling in the costs of driving? Those are the big questions we explore in this final episode of series 2.
You can also listen here…
Spotify
Presentation: Emissions Analytics Tire Technology Expo Presentation 20 March 2024
Our CEO & Founder, Nick Molden recently spoke at the Automotive Tire Technology 2024.
CEO & Founder, Nick Molden spoke at the Tire Technology 2024.


FUD off
Fear, uncertainty and doubt in an age of decarbonisation
Fear. Uncertainty. Doubt. This rhetorical triptych is increasingly used as an insult to describe interventions from anyone who deviates from the current environmental orthodoxy. When French philosopher René Descartes sat down in the seventeenth century Netherlands to write his Discourse on Method, he also faced FUD.
Fear, uncertainty and doubt in an age of decarbonisation
Fear. Uncertainty. Doubt. This rhetorical triptych is increasingly used as an insult to describe interventions from anyone who deviates from the current environmental orthodoxy. When French philosopher René Descartes sat down in the seventeenth century Netherlands to write his Discourse on Method, he also faced FUD. Fear that his beliefs about the world, both factual and ethical, were built on flimsy foundations. This led to great uncertainty in a time of religious adherence. The solution was doubt: to chip away at any beliefs that were not based on good reason, applying persistent and critical doubt. In doing so, he believed that he had rebuilt knowledge and faith but with firm foundations, based on his cogito ergo sum - I think therefore I am.

Rather than being used as an insult, FUD is what should be applied with urgency to the current debate about climate change and transport decarbonisation. Now faced with a growing body of information and concerns about a strategy of pure battery electrification being the optimal approach, we should stand back and re-evaluable. Chip away at the idols.
Descartes was a supreme rationalist, and reason is what we need. We debate tailpipe regulation, clean air zones and air quality largely with facts and figures, and logical arguments. Move onto climate change – a closely related issue – and calm, rational debate gets suspended in favour of polemics. This changes the nature of the debate in a way that destroys the debate. For many, doubt cannot be tolerated. Fear should used to keep order.
The “climate emergency”, as fearsomely styled, is serious. It is scientifically highly certain that climate change will have bad effects on humanity, possibly very bad. However, none of the standard models say that life and our planet will end, yet the challenge is being presented as an emergency, of existential significance. Of ontological significance.
But climate change is something to fear. There are many uncertainties as to what exactly will happen. Applying critical doubt is essential to working out the optimal response. So, let’s embrace FUD. Better than blind faith. There will always be strongly opposing views – centrist, European technocracy is an illusion – so rather than demonising the traditional energy sector or the environmental NGOs, let’s hammer it out as humans in the human realm.

One of the other more likely health risks in the garage experiment was from asphyxiation due to high CO2 levels, arising from the engine combustion. The parallel in the vehicle cabin is elevated CO2 due to respiration of the occupants. Human harm tends to occur when concentrations exceed 15,000 ppm, although cognitive impairment can occur well below that, which might lead to reduced reaction times and increased accident risk. While the garage concentration reached 8,509 ppm after half an hour, concentrations inside the vehicle when tested on the road reached just 1,564 ppm after the same time, even with the ventilation system on the ‘recirculation’ mode. On fresh air mode, concentrations rose by an average of just 13% above the 417 ppm background. As with PN concentrations, there were big variations between vehicle models as to how fresh the air was kept on recirculation: CO2 increased by 103% in the best case and 275% in the worst.
Overall, therefore, the particle exposure inside the cabin is a bigger risk than when locked in a garage with an idling ICE vehicle of the current generation. While CO2 concentrations in the garage were higher than in the cabin, driving a vehicle is operating a complex, mobile machine and, therefore, even a modestly elevated level of CO2 could compromise safety. It should be noted that some relevant pollutants have not been studied here. Particle mass was not chosen due to the relatively low levels being emitted from modern tailpipes and entering the cabin even with low-quality filters and ventilation systems. Nitrogen dioxide (NO2) emissions are extremely low from gasoline vehicles – the dominant powertrain now – and concentrations in the cabin are also very low. A major area of focus in our future work is the role of volatile organic compounds (VOCs). These tend to be low from tailpipes, although some species can be highly toxic even in low concentrations. Inside the cabin, these VOCs arise mainly from interior materials, especially in hot conditions. Some mix of compounds, of varying potential toxicity, evaporate from seats, carpets, dashboards and other plastics. In short, the greatest risks in the cabin are PN, CO2 and VOCs, while in the garage it is PN, CO2 plus carbon monoxide (CO) for gasoline vehicles and NO2 for diesels.
Taking this complex area and turning into something that vehicle owners and buyers can use practically, the AIR Alliance this month is launching its Cabin AIR Index, based on CWA17934. The most immediate action that can be taken, rather than changing the vehicle itself, is to swap the filter in the ventilation system. Changing the filter regularly is important to avoid degradation, and then the choice of filter brand is important. The initial test results – comparing six different filters on the same vehicle – show that the best filter reduced the interior pollution almost three times more than the worst filter. Therefore, this simple component of typically around $40 in value, can make a significant difference in chronic pollution exposure in the cabin.

For the truth is that there is much common understanding as to our environmental challenges. There are arguments as to the best solutions, and who should benefit and who should pay the price. And what is that largely common understanding? Decarbonisation of transport is vital, and electrification is the key. However, electrification is very different from “full electrification”, and electrification can manifest itself in many ways, including non-battery forms of storage. The real question is not whether battery electric vehicles will take off, but whether they will reduce total carbon dioxide (CO2) emissions as much as implied. Air quality continues to improve in most places, and new internal combustion engine vehicles are not the cause, but rather it is from older vehicles and non-tailpipe sources from a wide range of vehicles. Energy efficiency is one important aspect of emissions reduction, but cost efficiency is more important if maintaining our standard of living is the priority. ‘Net zero’ is nothing magical or sacrosanct. If we can get to net-minus-80% for half the cost, might that not be better for society in the round?
Or perhaps: cogito ergo sum hybrida.
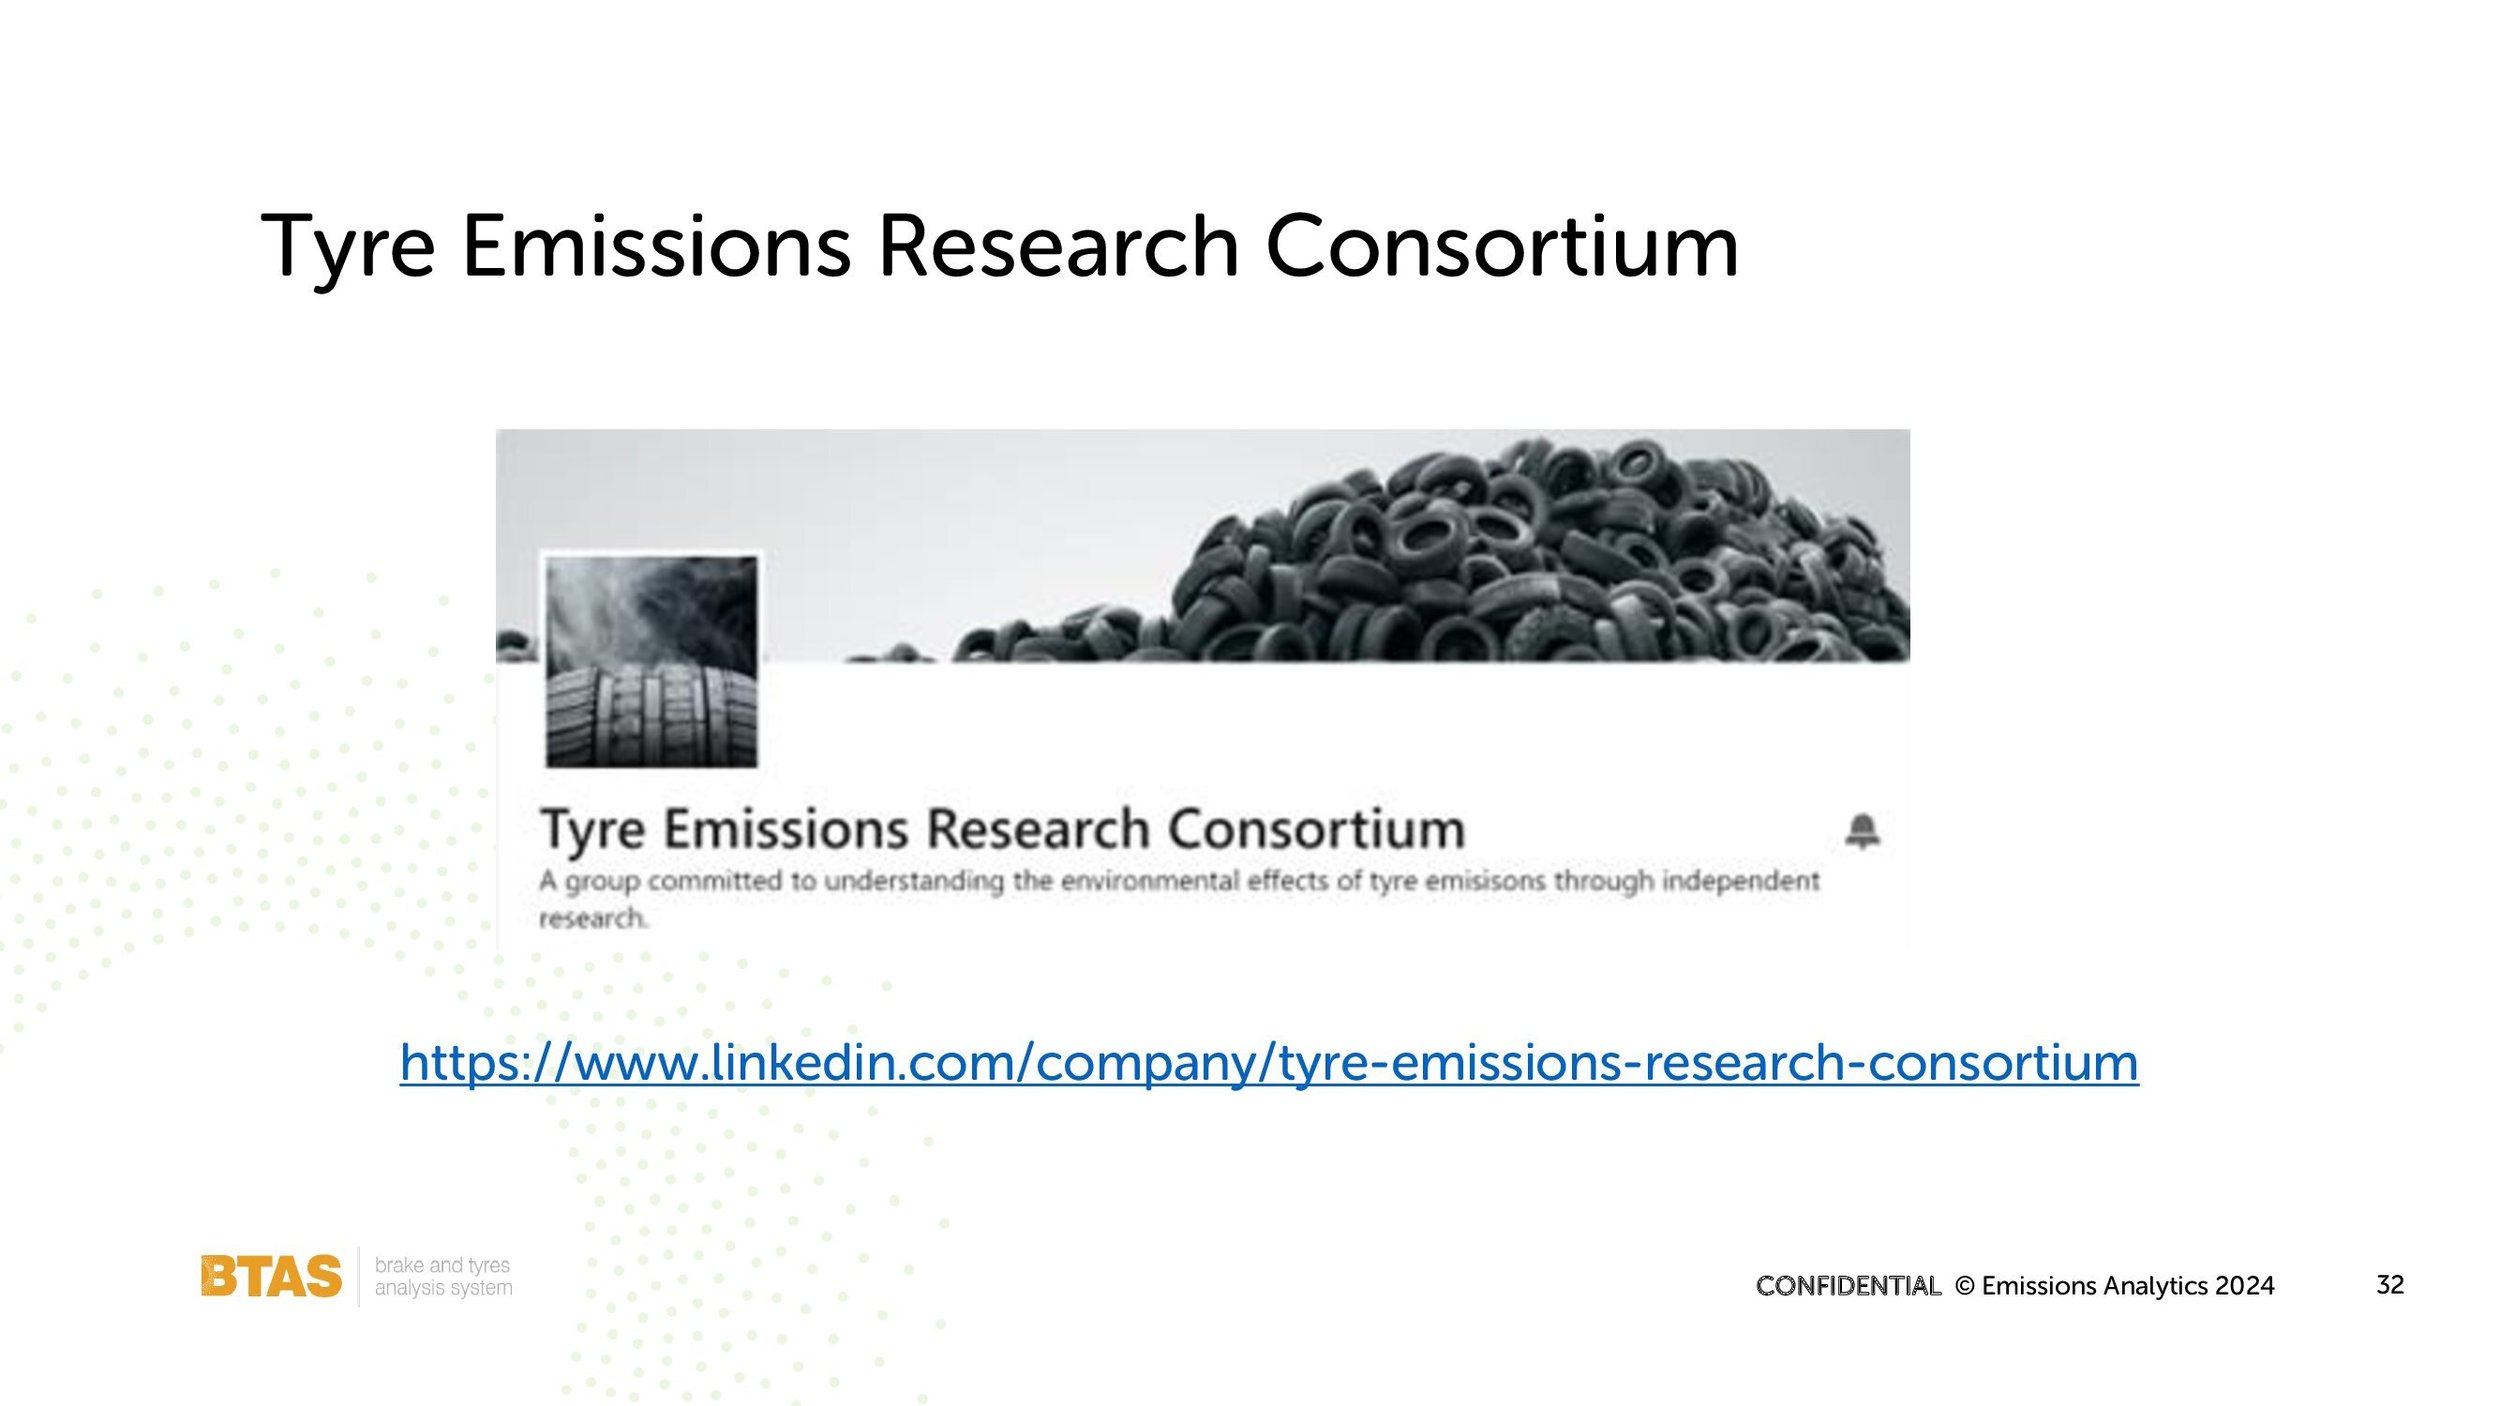
With the profound importance of these matters, Emissions Analytics will be redoubling its efforts to bring independent, real-world data to the debate. We will chip away persistently to reveal the facts, and to analyse, recognising uncertainties where they exist. We have for many years supported the work of the not-for-profit AIR Alliance in publishing free-access ratings for real-world nitrogen oxide (NOx) and CO2 emissions. In July, a rating for vehicle interior air quality was added, showing how drivers can reduce their exposures to ultrafine particles in the cabin. Early this year, we launched the Tyre Emissions Research Consortium, with the aim of bringing together researchers and interested parties from around the world to foster and accelerate understanding of how emissions from tyres affect air, water and the food we eat. Remarkably, it already has over 800 participants.

We are continuing to expand our in-house EQUA testing programme, which takes vehicles from the marketplace and subjects them to testing for their tailpipe emissions, tyre emissions, and materials off-gassing fumes as part of vehicle interior air quality. We offer access to the full data as part of our subscription products, but from this autumn we will also launch Emissions Intelligence, which will present a monthly webcast with the very latest results and interpretation in the context of market and regulatory developments. It will allow any market player to have their finger on the pulse of emerging problems and solutions, and will be free for all existing clients and collaborators.
The first webinar in the series will take place on Tuesday 19 September 2023, and will look at the latest developments in tyre emissions testing and regulation, and sharing highlights from our EQUA testing. Please sign up on our website.
Finally, in 2024 we will be launching a series of conferences, including a European conference on the decarbonisation and pollutant emissions reduction in the non-road mobile machinery, with a particular focus on renewable fuels. This is a classic area where electrification is valuable but cannot solve all problems – a multi-pronged approach is necessary. The programme will be published soon. Do sign up and attend if you are working in this area.
We invite you all to participate in these efforts. Please get in touch.
We embrace discussion and creative, fact-based disagreement. We are technology neutral, open to any approaches that can address global environmental problems while preserving standards of living. We don’t know all the answers. But we have a good instinct as to where to look.

Cabin fever
In our last newsletter we looked at the unethical challenge set by a high profile academic to see whether you would die if locked inside your garage with an internal combustion engine (ICE) vehicle running.
Why vehicle interior air quality is worse than in your garage
In our last newsletter we looked at the unethical challenge set by a high profile academic to see whether you would die if locked inside your garage with an internal combustion engine (ICE) vehicle running. Answer: no if you choose a current model, but probably yes if you choose something else and run it in a single garage. Don’t take the risk. But what happens if we invert the question? How safe is it to be inside the same car driven in the open air? That may sound like a stupid question, as most of us put ourselves in that position regularly, but how much do we really know about the quality of air inside a vehicle? Is it very different from standing in a garage with an idling engine?
The challenge of the garage test is that tailpipe emissions are being emitted into a confined space with limited air to dilute it. The question of air quality inside the vehicle cabin is actually the same: pollution from the ambient air is sucked into the sealed, confined space of the vehicle cabin. In fact, the interior air volume of the car is substantially less than the volume of the garage. This problem of pollution build-up, and the potential effect on driver health, has become more marked as the construction quality of vehicles has improved such that there is little air exchange except through the ventilation system.

To evaluate this, Emissions Analytics performed tests for vehicle interior air quality across over one hundred vehicles in Los Angeles in the US, Oxford in the UK, and Stuttgart in Germany. For each test, the interior air quality was measured in real-time for particle number (PN) and carbon dioxide (CO2) concentrations, simultaneously with testing for the same pollutants immediately outside the vehicle from a second, matched, analyser. Particle number was chosen as probably the single biggest health threat, and CO2 build-up is a driver safety issue representing the stuffiness of the interior air.
The test protocol was modelled on a new standardised methodology from CEN (Comité Européen de Normalisation or European Committee for Standardisation), published in September 2022. The CEN Workshop Agreement (CWA) 17934 was the product of Workshop 103, which was initiated and chaired by the AIR Alliance and attracted around 40 industry experts in its development and validation.
The US results, which were performed on a repeated thirty-minute route around Los Angeles International Airport, saw average external PN concentrations of 22,901 particles per cm3. For comparison, fresh country air is typically around 2,600 particles per cm3, and the concentration out of a post-2018 diesel exhaust averages just 10,000 per cm3. Across 97 recent model year light-duty vehicles tested on this route, the average interior PN concentration was 21,419 particles per cm3, so only 6.5% below the ambient. As an average this might suggest that filtration via the vehicle ventilation system is largely ineffective, but this is not true. The range of results was between 9,388 and 47,977 particles per cm3. On the Cabin Air Quality Index (CAQI) defined under CWA17934, the values were between 0.31 at the best-performing end, and 2.10 at the worst end. In other words, the vehicle with the best ventilation system protected its occupants by reducing PN pollution by 69% compared to outside, but the worst vehicle saw double the outside concentrations. This can be the case due to the accumulation of particles in a well-sealed cabin, and where the interior air is not properly refiltered. A similar pattern was seen on the European tests in terms of the relative concentrations between the inside and outside, but the outside concentrations in absolute terms were, about double – for example, around Oxford the average concentration was 43,312 particles per cm3. This may come as a surprise, but might be explained by the higher proportion of diesel vehicles with no or compromised particulate filters in Europe.
Thinking back to the garage thought experiment, over one hour with the idling gasoline vehicle in a single garage, the PN concentration rose from the 2,600 background to just 3,529 particles per cm3. Therefore, concentration rose by about a third, but remained 84% below the average exposure suffered by the occupant of the vehicle testing on the roads of Los Angeles. The chart below shows the instantaneous and cumulative concentrations from the road test on a Ford Explorer with average performance, compared to the modelled garage PN build-up. So, by a large margin, you are exposed to fewer particles in the sealed garage than driving in normal on-road conditions, and this is true due to two main factors. First, the exhaust filtration on new cars has an efficiency of over 99.9%, so these vehicles are emitting a very small net number of particles, even when the ambient air is relatively clean. Second, the ambient air for the road test has PN concentrations well above background, which must in turn come from sources other than modern vehicles with exhaust filters – most likely from older vehicles, non-exhaust emissions, industrial sources, farming and home heating. In other words, these modern vehicles with filtered exhausts are not a significant source of PN pollution, yet the occupants may still suffer the pollution from other proximal sources.
One of the other more likely health risks in the garage experiment was from asphyxiation due to high CO2 levels, arising from the engine combustion. The parallel in the vehicle cabin is elevated CO2 due to respiration of the occupants. Human harm tends to occur when concentrations exceed 15,000 ppm, although cognitive impairment can occur well below that, which might lead to reduced reaction times and increased accident risk. While the garage concentration reached 8,509 ppm after half an hour, concentrations inside the vehicle when tested on the road reached just 1,564 ppm after the same time, even with the ventilation system on the ‘recirculation’ mode. On fresh air mode, concentrations rose by an average of just 13% above the 417 ppm background. As with PN concentrations, there were big variations between vehicle models as to how fresh the air was kept on recirculation: CO2 increased by 103% in the best case and 275% in the worst.
Overall, therefore, the particle exposure inside the cabin is a bigger risk than when locked in a garage with an idling ICE vehicle of the current generation. While CO2 concentrations in the garage were higher than in the cabin, driving a vehicle is operating a complex, mobile machine and, therefore, even a modestly elevated level of CO2 could compromise safety. It should be noted that some relevant pollutants have not been studied here. Particle mass was not chosen due to the relatively low levels being emitted from modern tailpipes and entering the cabin even with low-quality filters and ventilation systems. Nitrogen dioxide (NO2) emissions are extremely low from gasoline vehicles – the dominant powertrain now – and concentrations in the cabin are also very low. A major area of focus in our future work is the role of volatile organic compounds (VOCs). These tend to be low from tailpipes, although some species can be highly toxic even in low concentrations. Inside the cabin, these VOCs arise mainly from interior materials, especially in hot conditions. Some mix of compounds, of varying potential toxicity, evaporate from seats, carpets, dashboards and other plastics. In short, the greatest risks in the cabin are PN, CO2 and VOCs, while in the garage it is PN, CO2 plus carbon monoxide (CO) for gasoline vehicles and NO2 for diesels.
Taking this complex area and turning into something that vehicle owners and buyers can use practically, the AIR Alliance this month is launching its Cabin AIR Index, based on CWA17934. The most immediate action that can be taken, rather than changing the vehicle itself, is to swap the filter in the ventilation system. Changing the filter regularly is important to avoid degradation, and then the choice of filter brand is important. The initial test results – comparing six different filters on the same vehicle – show that the best filter reduced the interior pollution almost three times more than the worst filter. Therefore, this simple component of typically around $40 in value, can make a significant difference in chronic pollution exposure in the cabin.

Of all the vehicles Emissions Analytics has ever tested, the Tesla Model X achieved the best cabin air quality rating, achieving PN concentrations more than 92% below outside levels. Both its bioweapon defence mode and its normal modes achieved excellent protection, thanks to a combination of HEPA (High Efficiency Particulate Air) filters. The downside of this approach is a large physical size (about 1.2 metres wide) and the relatively high replacement cost. The upgrade is around $500 currently. While originally only available on the Models S and X, since late 2021 it was also standard on the Model Y.
In summary, we have shown in previous newsletters that we are thinking about vehicle pollution in the wrong way now. New ICE vehicles emit almost no pollutants from the tailpipe, except CO2. To solve this decarbonisation challenge, we are moving to heavier electric vehicles, and in doing so are creating a tyre emissions problem that dominates anything from the tailpipe, as shown in a previous newsletter. In this newsletter, we have shown that being inside a vehicle can be more hazardous than being outside. In short, apart from replacing older vehicles as soon as possible, we should be concerned with non-exhaust and non-vehicular emissions rather than the tailpipe, focusing particularly on fine particles and VOCs from plastics and tyres. We have a good instinctive grasp of exterior air quality problems, but need to improve our understanding of interior pollution. Tesla is stealing a lead on the competition by acknowledging the issue of cabin air quality, and offering a practical solution today. Let us hope that other manufacturers follow, and the new CWA17934 standard can be used to prove their effectiveness.

Don't try this at home!
Increasingly simplistic calls to #Stopburningstuff and #Stickyourselftothings have recently been accompanied by another call: that anyone who challenges the virtues of battery electric vehicles (BEVs) should shut themselves in their garage alongside their idling internal combustion engine (ICE) vehicle for an hour, to see whether they emerge to tell the tale.
An emissions thought experiment
Increasingly simplistic calls to #Stopburningstuff and #Stickyourselftothings have recently been accompanied by another call: that anyone who challenges the virtues of battery electric vehicles (BEVs) should shut themselves in their garage alongside their idling internal combustion engine (ICE) vehicle for an hour, to see whether they emerge to tell the tale. This is a rather unethical, and arguably shocking, call that can only cheapen the decarbonisation debate. It is one thing coming from fringe on-line influencers, but quite another when it comes from well-known, vocal academics.
The tastelessness of the proposal aside, as Emissions Analytics is committed to using independent testing to understand real-world emissions questions, we have taken the challenge in the form of a thought experiment. The conclusions from previous newsletters are that modern ICE vehicles are extremely clean relative to older ones, while BEVs have low but non-zero pollutant and carbon dioxide emissions, leaving the optimal policy more finely balanced than typically thought. Contradicting this, does the challenge, while flippant, hold an essential truth?

Traditional thinking is that toxic fumes would quickly overwhelm you, while a BEV would sit there passively emitting nothing. Such an experiment tests in microcosm the effects of vehicles on the wider environment. To see what the likely effects would be, we can forecast pollutant concentrations in our test laboratory using Emissions Analytics’ real-world test data from tailpipes and non-exhaust sources, together with the latest academic research.
Without wanting to spoil the result, as with so much in the decarbonisation debate, the answer is nuanced and highly sensitive to the selection of the vehicles. So, it should be emphasised in the strongest possible terms: don’t actually try this at home!
A typical single European garage is about three metres wide, six metres long, and three metres high – so, about 54 m3 in volume, which is similar to one of our laboratories. Let’s assume a constant ambient temperature of around 20 degrees Celsius, which is in line with the temperature used for a vehicle certification test. Vehicle emissions should be estimated from cold start, with the engine having been soaked at the same temperature overnight. For the thought experiment, it is assumed that no pollutants escape the laboratory, although some gas egress would be necessary to avoid gradual pressurisation of the space. To avoid accusations of sophistry, we will assume that the ICE vehicle does not have stop/start or other cut-out system engaged, so it is idling throughout.
The laboratory is assumed to contain air with standard background gas and particle concentrations, as shown in the table below. Also indicated in the table are guides as to when concentrations of each pollutant start having negative human health or cognitive effects (the ‘threshold of harm’), and the immediate danger levels. These danger levels have been compiled from multiple sources, many from the world of occupational safety. For some, there are some wide variations in views, but we have tried to pick a fair midpoint for the purposes of illustration. The references are listed at the end of the newsletter.

First, let’s first take the controversial one: a diesel. Diesel is a fuel that burns around a quarter more efficiently than gasoline and was for a generation pushed as a route to decarbonisation, only then to be undermined by excessive real-world NOx emissions. Many air quality problems we suffer today arise from these excesses. In this case, we have taken a 2021 Volkswagen Passat 2.0 litre 148 bhp front-wheel drive automatic vehicle certified to the latest, strict Euro 6d-ISC-FCM emissions standard. The results are modelled by using the second-by-second data from an actual real-world test by Emissions Analytics on its EQUA test route, using a Portable Emissions Measurement System (PEMS) augmented by sampling of VOCs onto thermal desorption tubes for later GCxGC-TOF-MS analysis.

During this hypothetical experiment, the vehicle would suck in and then emit about 30 m3 of gas – mainly nitrogen – which is equivalent to about 55% of the total laboratory air volume. The colour coding indicates whether the concentration after one hour is below the no-harm level (green), or between the no-harm and immediate danger level (amber). We have also considered whether the process of combustion would use sufficient oxygen from the air to create an asphyxiation risk. Clear to see is that there is no red, which would indicate immediate danger.
The most dangerous pollutant, therefore, is nitrogen dioxide, but the forecast levels are still half of the recommended immediate danger levels, despite the amount of air in the laboratory being relatively small. Even with this worst-case pollutant, if the volume of the laboratory were just 1,438 m3 (about 27 single garages, or the interior volume of an Airbus A380 aircraft), the amount of air would be sufficient to dilute the NO2 to the point of no harm. Put this car in the open air, and you can see why this powertrain is no longer a problem from an urban air quality point of view.
The experiment was then extended to a modern gasoline vehicle: a Renault Clio 1.0 litre 88 bhp front-wheel drive manual vehicle certified to the Euro 6d-TEMP-EVAP emissions standard. The main difference in the outcome is for NO2, which is now at a negligible level, and CO, which is about double the diesel vehicle. Carbon monoxide is rightly feared as highly poisonous gas to humans, and even modern gasoline vehicles emit a significant amount when the engine is cold, but after about two minutes the catalytic converter brings it down to low levels, even in dynamic driving. As this engine is smaller than the diesel one, the total amount of gas ingested and then exhaled in one hour is only around 12 m3, or 22% of the total volume of the laboratory.

So, for both ICE vehicles, idling in a single garage for an hour, is likely to be negative for your comfort, health and enjoyment, but not fatal. But are we covering everything? If we sit alongside a BEV, are there any effects at all?
As we showed in a previous newsletter, VOCs don’t just come out of the tailpipe, but also ‘off-gas’, or evaporate, from the surface of car tyres, as they are substantially made from components of crude oil. For the Tesla Model Y tested, we found that total VOCs from the tyres was 0.26 grams over one hour. If these tyres were the only source of VOCs, they would lead to 1.2 ppm in the laboratory at 20 degrees Celsius. The distinctive smell experienced when entering a tyre warehouse is caused by these VOCs.
There are two further non-exhaust sources of VOCs. First, fuel evaporates from the fuel tank of an ICE vehicle, even though most gasoline vehicles have ‘canister’ systems to capture as much as possible. The US Environmental Protection Agency Tier 2 regulations limited these emissions to 0.05 g/mile (0.03 g/km), and they have been tightened significantly since. If 60 km were travelled in one hour, this would mean evaporative emissions of 1.8 grams.
Second, a recent academic paper on unreported VOC emissions from road transport highlighted the issue of VOCs from the evaporation (not usage) of screenwash, which contain a mix of mainly alcohols, and which the authors termed “non-fuel, non-exhaust” emissions. The paper proposes a distance-specific emissions factor of 58 mg/km. To convert this to grams per second for the purposes of our experiment, we assume the same average speed of 60 km/hour as above for the test cycle the emissions factor was derived for. That implies total emissions over one hour of 3.5 grams.

In total, these non-exhaust VOCs add up to between 3.8 and 5.6 grams over the hour. The lower end of the range is for the BEV, as there would be no fuel evaporative emissions, although this may be offset by larger tyres, which is a trend with battery vehicles due to their weight. The totals for the exhaust alkanes and aromatics were 0.07 grams for the diesel and 0.11 grams for the gasoline. Therefore, the non-exhaust sources are around 50 times higher than the exhaust VOCs. In summary, it is best to not to dwell in a small, sealed space, whether it contains an idling ICE vehicle or a BEV that is switched off.
To this approach there is one important caveat. Change the car to an older one, and the outcome may not be as favourable. Older gasoline vehicles can have much higher CO emissions, a gas that can have rapid and terminal effects, while older diesel vehicles are famous for their elevated NOx emissions. The Volkswagen Passat examined here had NOx emissions of 19 mg/km when tested on Emissions Analytics’ combined EQUA route. This is 76% below the regulatory limit, which is typical of the current generation of diesels. Wind back only five years, and the emissions would have been more like 400 mg/km. Being locked in the garage with that car would lead to a poor health outcome. This is why, fundamentally, the Ultra Low Emission Zone in London, and similar schemes in other countries, are beneficial to air quality, as it is the older vehicles that are a disproportionate source of pollution.
The conclusion from this analysis, apart from avoiding academics with unethical experiments, is that how we think about vehicle emissions is ripe for a complete overhaul. Most of the impacts come from the tailpipe of older vehicles, and from non-exhaust sources on new vehicles. Any properly functioning modern vehicle, operating in the open air, will contribute a negligible amount to air quality problems from the tailpipe. The carbon dioxide problem remains, however, which is the subject of extensive discussion elsewhere.
It remains true that ICE vehicles produce a range of potentially highly toxic compounds from combustion, but at current concentrations when rapidly diluted in the open air, they cease to be a major problem. But this insight points to the next major are of concern: inside the vehicle cabin. Pollutants from older vehicles enter through the ventilation system, and VOCs evaporate from the interior materials, to which the driver and passengers are exposed over extended periods within a sealed cabin. Without the benefits of dilution and filtration in a poor ventilation system, the health exposures can be significant. We will look at this in our next newsletter…
References
Carbon dioxide (CO2): https://www.fsis.usda.gov/sites/default/files/media_file/2020-08/Carbon-Dioxide.pdf
Carbon monoxide (CO): https://www.epa.gov/indoor-air-quality-iaq/carbon-monoxides-impact-indoor-air-quality
Nitrogen oxides (NO2): https://nj.gov/health/eoh/rtkweb/documents/fs/1376.pdf
Nitrous oxide (N2O) http://www.ilo.org/dyn/icsc/showcard.display?p_card_id=0067&p_version=2&p_lang=en
Particle number (PN): Emissions Analytics' testing
Formaldehyde (CH2O): https://www.osha.gov/sites/default/files/publications/formaldehyde-factsheet.pdf
VOCs: https://getuhoo.com/blog/home/understanding-vocs-and-its-effects-on-health

What matters is not the promise of electric vehicles but the actuality
Friday 18 September 2015 saw Dieselgate break. This was the culmination of a growing dissonance between real-world nitrogen oxide (NOx) emissions and official values for cars and vans. The rupture was created by governments picking a technology, for the purposes of decarbonisation, where too much was taken on trust within a fragile governance system.
Friday 18 September 2015 saw Dieselgate break. This was the culmination of a growing dissonance between real-world nitrogen oxide (NOx) emissions and official values for cars and vans. The rupture was created by governments picking a technology, for the purposes of decarbonisation, where too much was taken on trust within a fragile governance system. The industry said, rightly, that technology existed to solve the NOx emissions. The sad reality was that this technology wasn’t deployed in a way that actually reduced NOx enough in practice, and Europe has been dealing with the air quality consequences ever since.
Equivalent failures must not happen as we try new routes to decarbonisation, especially as a generation has been lost with the diesel experiment. Many air quality problems have been solved even with internal combustion engine technology, with the simpler challenge remaining of updating the car parc. But decarbonisation is harder, and that is why the promise of battery electric vehicles (BEVs) – the leading contender in light-duty vehicle CO2 reduction – is rightly being scrutinised in exhaustive detail.

Mr Bean actor and car collector Rowan Atkinson’s recent intervention, saying he felt “duped” by the green claims of BEVs, caused a stir, not least because the article appeared in The Guardian, a well-regarded, environmentally conscious UK newspaper. Much electronic ink has been spilt since, including a subsequent ‘fact check’ by Simon Evans, a climate journalist, in the same publication. In the spirit of open enquiry and technology neutrality, and given the importance of the topic, we decided to perform a ‘fact fact check.’ In doing this, Emissions Analytics’ only motive is to get as close to the truth as possible, and to acknowledge where we have uncertainties.
In headline, most of what Simon Evans wrote is true, including:
BEVs won’t solve all the problems associated with car use. Our comment: very true, and may in some specific cases make them worse.
BEVs reduce greenhouse gas emissions by two-thirds on a lifecycle basis relative to combustion engine cars in the UK, and the benefits are growing. Our comment: performing accurate lifecycle analysis is exceedingly hard, and the answer is sensitive to your choice of model and input assumptions. The two-thirds claim is in the range of plausible estimates, even though Emissions Analytics’ work put the estimate closer to half currently. Nevertheless, the point stands.
Emissions from producing batteries are significant, but are quickly outweighed by the in-use emissions from gasoline and diesel cars. Our comment: how quickly depends on the true lifecycle emissions of the battery, vehicle and fuel, but it is most likely to be in the two to seven year range in the UK (with a wider range across Europe). Given that a car typically lasts about 13 years, anywhere in this range could be deemed quick.
Hydrogen is not a mainstream and proven technology in the same was as BEVs are currently, although it may improve too. Our comment: we agree – it is predicted to improve, and may emerge as the preferred solution for freight transport where the size of the battery is problematic.
Battery electric technology is the most energy efficient of the alternatives. Our comment: true, noting that efficiency is an important but not the only consideration.
Batteries may well outlast the rest of the vehicle. Our comment: data on battery longevity is encouraging on the whole.
Lithium-ion batteries do not contain rare earth elements. Our comment: batteries often contain scarce materials, and rare earths are used in electric motors.
However, there is one sentence in the article that we should focus on in particular. Not that it is incorrect, but that it is true in a dangerous way:
“Indeed, without a widespread shift to EVs, there is no plausible route to meeting the UK’s legally binding target of net zero greenhouse gas emissions by 2050…” [To clarify, in context “EVs” meant BEVs, excluding hybrids.] This sentence is important because it is a fact, but it is a fact by definition. In other words, legislation defines BEVs as zero emissions. Bingo! But are they actually zero emissions? No, as Simon Evans correctly points out. The manufacturing and electricity-generation emissions are defined out of the equation. The manufacturing emissions are mostly parked offshore; in practice most of them occur in China, where battery materials and processed before they can be utilised.
So, we have a rapidly looming echo of Dieselgate. You cannot define your way to decarbonisation. Repeating the assertion that BEVs are zero emission doesn’t make it any more true. BEVs in the UK are lower carbon than any current alternative – that is true. But they come at a cost and with consequences – economically, geopolitically, environmentally, ethically – that make them no more than a highly promising and valid alternative alongside many others.
Let’s not wake up on Tuesday 18 September 2035 to find that we have applied gargantuan resources, failed to reduce CO2 enough, and created new unpleasant side-effects.
So, Rowan Atkinson may be right for the wrong reasons, and others wrong for the right reasons. The truth is that Europe, and the world, perhaps cannot afford another Dieselgate.
Environmental justice
The term ‘environmental justice’ can often be used in a mushy, socialistic sense, but behind it is a deadly serious concept. Put broadly, it means that all parts of society should be treated equally under environmental law, or that everyone has the right to the same protection from pollution and other harm from emissions.
Why distributional efficiency matters
The term ‘environmental justice’ can often be used in a mushy, socialistic sense, but behind it is a deadly serious concept. Put broadly, it means that all parts of society should be treated equally under environmental law, or that everyone has the right to the same protection from pollution and other harm from emissions. More strictly, it can be seen as a form of allocative efficiency. In other words, environmental interventions should be directed where they create the most benefit, up to the point that the marginal benefit equals the marginal cost of delivery. Protection from emissions shouldn’t be the preserve of the rich or powerful, but should be judged beneficial for anyone to whom it can deliver a net improvement in the quality of life. Applying this concept is important in any free society where people are not all living in the same circumstances, with the same preferences and behaviours.
Through this lens, we can develop an additional perspective on the current debate around the decarbonisation of transport. In doing so, we can see that a multitude of solutions is the optimal approach not just because of constraints on resources, the actions of hostile states, and the state of our electricity grids, but also because people are diverse, and society’s interests are best served by giving each person the most suitable mode of transport.

Switching from an internal combustion engine (ICE) vehicle to a battery electric vehicle (BEV) is an investment. As well as the obvious financial investment on the part of the buyer, it is an environmental investment in the sense that higher carbon dioxide (CO2) emissions are generated during manufacture which are then offset during the usage of the vehicle. As a good guide, the CO2 footprint of BEVs is greater than that of ICE vehicles because of the emissions from making the battery, as the elimination of the engine and other components is roughly offset by the electric motors. Further, electricity generation according to the average mix in Europe or the US creates about as much CO2 as the oil extraction, refining and distribution. Therefore, switching to a BEV initially makes CO2 worse, until a ‘break-even’ point is reached after a period. It should be well noted that these averages are offered as a rule-of-thumb in order to simplify a complex picture and reveal the break-even concept, not to downplay the actual variability and spread in manufacturing emissions, grid mix and so on in specific places.
Estimates of how long into the life of a vehicle the break-even point is reached vary widely, as the result is sensitive to the interaction of the following main factors:
Carbon intensity of the electricity grid
Embedded carbon in battery manufacture
In-use vehicle emissions rates
Distance driven per year.
Electricity grids vary from near-zero CO2 in France to largely coal in Poland – in the latter scenario most BEVs never pay back the manufacturing CO2. Embedded carbon in battery manufacturing typically varies between 2.5 and 16 tonnes, which is driven by a combination of mining, refining and transporting the wide range of rocks and minerals required. In-use emissions from modern gasoline engines average around 184 g/km according to Emissions Analytics’ real-world EQUA testing on European vehicles, but most fall in the range from 107 g/km for the best fully hybridised engines to 248 g/km for non-hybridised sports utility vehicles. As a result, even assuming average driving distances per year, you can get almost any answer for the CO2 break-even date, depending on your location and the type of the comparator vehicles. As a guide, most commonly cited break-even points fall between two and eight years.
This analysis, however, neglects the vital element of the distance driven per year, which is often – as above – assumed away as some representative average. According to Field Dynamics, in 2019 – pre-Covid – the average UK car was driven 7,124 miles (11,470 km). The UK is around the average of European countries in this respect. The distribution of annual miles across all cars subjected to periodic technical inspection (PTI) saw the majority of cars with less than 5,000 miles per year (8,050 km) and just 0.5% above 30,000 miles (48,300 km). This matters because the fewer miles driven, the longer it takes to reach the break-even CO2 point. The table below compares trading in your old ICE vehicle for a typical BEV, rather than changing to a typical full hybrid electric vehicle (FHEV) emitting 120 g/km.

* Proportion split pro rata from original report.
On the other factors above, typical average values have been taken: average grid carbon intensity for Europe and seven tonnes of embedded carbon in the battery. Calculations here take the mid-point of the distance ranges, and the top group is assumed to have an annual mileage of 35,000. The CO2 and break-even calculations assume driving behaviour is the same between the different vehicles. It is further assumed that vehicles have a twelve-year useful lifespan on average; while many last longer than this, the number of miles driven falls rapidly as they enter a twilight life of reduced use. We should note that there is a potential bias in these numbers as vehicles are not subject to the PTI test in the UK until three years old.
These results prove that the more intensively a BEV is used, the quicker it will pay back the CO2 investment. For the heaviest users, that payback will be within one year, and deliver about ten times the overall CO2 savings than in the original battery manufacture. At the same time, the lightest users never practically pay back that investment if they switch to a BEV, only offsetting half of the battery emissions. Therefore, those light users are much better switching to the FHEV. Most crucial is the proportion of cars that fall into this category: about one third. If these people take the FHEV option rather than switching to the BEV, the overall reduction in CO2 across the fleet would be 17% greater, and the reduction in the need for scarce battery materials would be around 32%.
This proportion will of course be lower in countries with cleaner grids, where the batteries have been manufactured using cleaner energy and the in-use emissions of the ICE vehicles are higher. Equally, the proportion will be higher in the opposite circumstances.
Applying a similar calculus to the US, we see that it is generally a much more suitable region for vehicle electrification. While it shares a similar pattern of grid electricity to Europe – majority based on fossil fuels, with big variations between regions – other factors work to its advantage. First, US car owners travel around 13,500 miles (21,600 km) per year on average, almost double the European average of about 7,000 miles (11,200 km). Therefore, a US driver pays back the CO2 invested in a BEV's manufacturer in half the time. Second, US wholesale energy costs around one quarter of Europe’s, so it can more credibly and competitively build the necessary extraction and processing supply chain, rather than just the final battery assembly part. Third, North America is the global region with the highest degree of urbanisation, and BEVs offer the biggest efficiency gains in urban driving, due to powertrain efficiency at slow speeds and regenerative braking.

In summary, this analysis can be put as: why are we forcing light car users to spend more money on vehicles that actually pollute the planet more? While Zero Emission Vehicle (ZEV) mandates may be direction-finders and worthy aspirations, it is also very important we make sure that those who do convert to BEVs are the right people, from an allocative efficiency point of view. ICE bans are even more problematic than ZEV mandates because ‘success’ would be wilfully suboptimal A better approach would be to drop the bans and be highly selective with mandates, and rely more on the CO2 targets and/or carbon pricing to set the direction and then let the industry and consumers rearrange their supply and demand accordingly to deliver the best environment outcome in the most efficient, speedy and equitable way. In this way, lightly used cars would not be swapped for BEVs, saving money and CO2. That would be true environmental justice.

Champagne Supernova?
When an exploding star led to the observation of supernova SN 2003fg in 2003, it was nicknamed the ‘Champagne Supernova’ due to its unusual brightness, and its inexplicably great mass. Many supernovae eventually succumb to their own weight, leaving behind a black hole. Are we at this stage with battery electric vehicles (BEVs)?
A bright light, with a heavy weight
When an exploding star led to the observation of supernova SN 2003fg in 2003, it was nicknamed the ‘Champagne Supernova’ due to its unusual brightness, and its inexplicably great mass. Many supernovae eventually succumb to their own weight, leaving behind a black hole. Are we at this stage with battery electric vehicles (BEVs)? Their prospects are currently shining brightly despite their literal weight as well as their likely wider toll on the environment, from watercourses to the seabed, due to their production. Hybrids, by contrast, tread relatively lightly on the planet, yet give off a more muted glow of past glory – perhaps more like a red dwarf. In this newsletter we want to consider a further way in which vehicle size and weight matter, and why the BEV industry must address this rapidly if it is successfully to deliver pollution reduction.

Astronomical parallels aside, we can simply say that BEVs are too big and heavy right now. Yes, there are heavy internal combustion engine (ICE) vehicles, but on average BEVs are around 40% heavier and 40% bigger like-for-like, as set out in a previous newsletter. This trend may well continue, and the weight premium increase, as BEVs come increasingly equipped with lithium ion phosphate (LFP) batteries as they are cheaper and require fewer scarce materials. It may even be the case that this weight leads to structural risks for transportation infrastructure, such as roads and car parks, although this has yet to be proven.
While this is all true, it is easy to get stuck in a pattern of ‘trading averages.’ As Senecal et al meticulously pointed out, you can only assess the decarbonisation potential of BEVs in the US by looking at local-scale grid electricity, and marginal rather than average carbon intensities. Similarly, with vehicle selection, you can only judge the benefit by understanding the marginal changes. If someone replaces a frugal gasoline car with a larger BEV, that is likely to be worse for the environment in the round. Equally, switching from a large gasoline V8 to a small city BEV is very likely to be better. It is easy to make simplistic ‘stop burning stuff’ slogans stick when you conjure up the image of a pre-particle-filter diesel being replaced by a gleaming Tesla. However, for the same investment, you are likely to get more pollutant and carbon dioxide (CO2) emissions reduction from trading those old diesels up for the latest full hybrid electric vehicles (FHEVs). So, what we mean by an ICE vehicle, and the variation in performance within that group, matter. Put another way, it is not the optimal approach to dispense with all ICE technology just because many are high-emitting, just like it would be wrong to reject all BEVs just because many are currently very heavy.
Our previous newsletter suggested that tailpipe emissions from FHEVs had reached a ‘do no harm’ status, by showing levels more than 90% below a range of air pollution legal limits. What this did not show was whether those apparently low levels were in fact sufficiently de minimis to be of little concern, or whether we were still burning stuff in a detrimental way for air quality. An immediate caveat to make is that there is a relevant difference between this European test and apparently similar US vehicles. In Europe, unlike the US, a large and increasing proportion of gasoline ICE vehicles are equipped with particle filters, which significantly reduce the particle mass and number emissions from the tailpipe. Therefore, US particle emissions remain concerning and, as a result, there is greater benefit in switching to BEVs in that market, in the absence of widespread adoption of these filters.
That said, we can look more closely at the volatile organic compound (VOC) emissions from the same test to put the results in context. We showed that there were 4.38 mg of tailpipe emissions over our EQUA test, or 0.03 mg/km. This compares to the most relevant official limit of 100 mg/km for total hydrocarbons, which puts the car more than 99% below the limit. These low emissions were compared to the 330 mg emitted from the tyres on the same test. But, still, how bad is 0.03 mg/km? A recent paper, from March 2022, in Environmental Science & Technology by Wang et al, measured the VOC emissions from four humans seated in a controlled climatic chamber, using proton transfer reaction time-of-flight mass spectrometry and gas chromatography. Without the presence of ozone, the emissions averaged 2.2 mg per human per hour, rising to 4.6 mg in the presence of ozone. Averaging these, and applying the result to the length of the EQUA test, it would imply that a human driver would emit 12 mg of VOCs in total. Therefore, during the EQUA test the driver may have emitted three times more pollution from his body than came out of the tailpipe of the car being driven. Stop metabolising stuff!

So, we can see that the levels of regulated exhaust pollutant emissions from the FHEV are now trivially low. Of those not regulated, the sub-23 nanometre, ultrafine particles are probably the greatest omission, which is being addressed by regulators soon, as set out below. What is left is a more serious concern about VOC emissions, especially from tyres. There are three main reasons we should be concerned about such emissions. First, VOCs can have a direct health effect through inhalation or contact with the skin – many are harmless, but the worst organic compounds can be carcinogenic. Second, VOCs can react in the air to create ‘secondary organic aerosols’ (SOA), i.e. new particles, for which the health and environmental effects are well described elsewhere. Third, these organic compounds have an ‘ozone formation potential’ (OFP), ground-level ozone being one of the main constituents of the smog hanging over city skylines.
From the testing on the Tesla and Kia described above, we see tyre VOC emissions of 2.2 mg/km from the Kia and 6.1 mg/km, from the larger-wheeled Tesla. Taking the ‘secondary organic aerosol formation potential’ (SOAFP) for five target compounds and the average value for the remainder from Wang et al (2017), this implies a maximum possible particle formation of between 0.03 mg/km and 0.1 mg/km. The latter is shown in the table below, which is from the Hankook tyre on the Tesla. This may sound low, but tailpipe particle emissions are now as low as 0.02 mg/km, so the tyre VOC emissions could more than five times the tailpipe mass emissions.

Using a similar approach for ozone formation, the test could have yielded up to 13.2 mg/km. There are no direct regulatory benchmarks to compare this to, however.
This shows not only that tyre size matters, but that chemical composition does as well. From over three hundred tyres tested by Emissions Analytics, the surface area of light duty vehicle tyres – from which the VOCs evaporate – can vary by around 100%, depending on whether you have a 155/60 R15 skinny summer tyre, or a 235/65 R17 specialist SUV tyre, for example. Across 73 tyre manufacturers tested, the proportion of aromatics – some of the more potentially toxic compounds, and highlighted compounds in the table above – vary in concentration from 78 to 582 micrograms per milligram of sample. In other words, the concentration of certain chemicals, and the surface area from which they can evaporate, varies significantly between tyres. As a consequence, vehicle size and weight, with the tyres that accompany that, evidently affect emissions in use, in addition to the materials required for their construction.
This shows not only that tyre size matters, but that chemical composition does as well. From over three hundred tyres tested by Emissions Analytics, the surface area of light duty vehicle tyres – from which the VOCs evaporate – can vary by around 100%, depending on whether you have a 155/60 R15 skinny summer tyre, or a 235/65 R17 specialist SUV tyre, for example. Across 73 tyre manufacturers tested, the proportion of aromatics – some of the more potentially toxic compounds, and highlighted compounds in the table above – vary in concentration from 78 to 582 micrograms per milligram of sample. In other words, the concentration of certain chemicals, and the surface area from which they can evaporate, varies significantly between tyres. As a consequence, vehicle size and weight, with the tyres that accompany that, evidently affect emissions in use, in addition to the materials required for their construction.
What does this mean for regulation? The current Euro 7 proposals are generally a sensible step, as set out in a previous newsletter, not least to make the regulations more technology neutral and tighten ultrafine emissions limits. A less prominent part of the proposal is to tighten the ‘evaporative emissions’ test. This is designed to limit the VOCs off-gassed during refuelling and the use of vehicles, for example vapour escaping from the fuel tank. The test is conducted in a controlled chamber and the escaping VOCs collected over a one-hour period when the vehicle is hot followed by 48 hours when it is cool, all with the ambient temperature varying across a ‘normal’ range. Currently, the total emissions must be less than 2 grams, although this may be significantly reduced with Euro 7. This is relevant because the test, although not specifically designed to do so, will pick up off-gassing from the vehicle’s tyres. However, this is one respect in which Euro 7 is not technology neutral: the evaporative test only applies to gasoline vehicles. So, BEVs with large tyres have no limits applied.

In conclusion, we have shown the risks of myopically looking at tailpipe emissions, and the dangers of asserting the environmental impact of vehicles simply from the type of powertrain. In short, environmental logic points towards a mixed car parc made up mainly of smaller BEVs to cover town driving and larger FHEVs for more general purposes, brought about as quickly as possible in order to get the black hole of older, dirty cars off the road as soon as possible. Vehicle weight, and hence emissions, should be minimised to allow the smallest tyres that are safe and effective. This is a lower risk approach, and from an economic point of view a ‘lower regret’ option as we would not be gambling resources of potentially up to $1 trillion globally, according to some reports, on a maxi-BEV technology that may not deliver its promises. If we pivot to this lighter approach, in ten years’ time, as with 1990s Britpop Oasis’ champagne supernova, you might not have to wipe that tear away now from your eye.
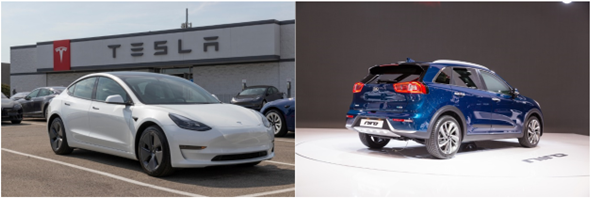
Do No Harm
Emissions Analytics performed a comparison test between a Tesla Model Y and a Kia Niro full hybrid electric vehicle (FHEV), on itsreal-world EQUA test cycle conducted in the UK in March 2023.
How efficiency does matter
In our last newsletter we showed how the energy efficiency of vehicles is not the only consideration in decarbonisation. We should also think about efficiency of resource allocation. Resources are scarce, and the job of decarbonisation is big, so we need to invest our money carefully. One way to judge this is to consider an alternative measure of optimality: Pareto efficiency. Vilfredo Pareto was a nineteenth century Italian economist, who described a system being Pareto efficient when is not possible to change the allocation of goods without harming at least one person. Interpreting that for transport decarbonisation, we can say that a change of powertrain can be a Pareto improvement if it is possible to improve all relevant aspects without disadvantage to someone. For clarity, following Pareto improvements does not necessarily lead us to the globally best outcome, but offers relatively easy ‘wins-wins’, opportunities which are scarce in complex modern economies. What can this tell us if we apply it to some real-world test data?

To study this, Emissions Analytics performed a comparison test between a Tesla Model Y and a Kia Niro full hybrid electric vehicle (FHEV), on its real-world EQUA test cycle conducted in the UK in March 2023. The vehicles were less than one year old, equipped with the original tyres, with similar tread depths, and closely matching odometer readings. Both are standard size sports utility vehicles, with the same number of seats, while the Tesla is physically slightly larger. Importantly, due primarily to the 78.1 kWh battery, the empty weight of the Tesla was 489 kg greater. From a driveability point of view, this is offset by almost treble the power and double the maximum torque. The detailed specifications are shown in the table below.

Selecting the appropriate pair of vehicles presented various dilemmas, and the conclusion was that there is no perfect answer. Perhaps the most obvious approach would have been to compare the hybrid to a Kia Niro EV. From an engineering point of view this would have been a good like-for-like comparison. However, Emissions Analytics is committed to understanding what happens in the real world and, therefore, it would be unwise to the neglect the biggest selling battery electric vehicle (BEV) by revenue in the world in 2022, the Tesla Model Y. The pairing of this with the Niro hybrid reflects a common choice that real customers are making, even if that means a technically less perfect comparison. As evidence of this being a good comparison, the table include effective monthly lease costs, which shows there is less than 10% difference. These figures assume the buyer is a company car driver paying the higher rate of income tax in the UK, which reflects the most common type of buyer; the difference is caused by the low benefit-in-kind tax on the BEV. The mix of incentives varies around the world, some more generous, some less so.
With the background of climate change and Dieselgate, there is a strong narrative that we need to “stop burning stuff” to solve our environmental problems. Non-combustion sources of emissions, such as from tyres, typically get dismissed as just big chunks/having no air quality effect/not very toxic/inconvenient. At the same time, some BEV owners report that they see lower tyre wear, and other higher wear compared their previous internal combustion engine (ICE) vehicle. However, it has been unclear whether there has been simultaneous behaviour change, in terms of driving style or routes, or the measurements are unreliable.
For this test, the vehicles travelled in convoy to eliminate any effects of driving style or climatic conditions. The Kia was instrumented with a tailpipe Portable Emissions Measurement System (PEMS) and the Tesla with an equivalent mass. The test cycle was made up of five repeats of the EQUA cycle, totalling 741 km. At regular points through the test, all the wheels were dismounted, cleaned, weighed and remounted to calculate the mass loss. The results, compared to the relevant regulatory limits, are shown in the table below.

The mass loss data points and trend over the total distance are shown in the chart below.

The first striking result is that there are almost no tailpipe pollutants measured from the Kia except carbon dioxide (CO2). The gasoline particulate filter reduces particle mass to almost zero, and particle number to 97% below the Euro 6 regulatory limit. Every air pollutant is comfortably more than 90% its limit. While there is no limit value for CO2, compared to the average of all the current-generation gasoline vehicles we have tested, the Kia is 38% lower at 113.4 g/km. The Tesla is, of course, zero on all these measures; we are ignoring upstream emissions in this test.
Turning to the non-exhaust, the second striking finding is that tyre wear mass emissions are five orders of magnitude greater than particle mass from the tailpipe. This is two orders of magnitude greater than in previous tests by Emissions Analytics on different vehicles. Further, tyre wear emissions were 26% greater from the Tesla, due to the extra weight and torque, despite their being specifically-designed ‘green tyres’ for electric vehicles. The gap may have been greater had the car not been equipped with special EV tyres. In absolute terms, the increased tyre wear was 11 mg/km, which is 2.4 times the maximum permissible tailpipe particle mass emissions.
So, as tailpipe air pollutants were tending to zero from the Kia, it is a fair summary to say that a consumer choosing between switching from a traditional gasoline internal combustion engine (ICE) vehicle to either a Kia Niro hybrid or a Tesla Model Y, is weighing up an extra 62% point reduction in CO2 against a 26% increase in particle emissions. However, if full lifecycle CO2 emissions are taken into account, BEVs currently offer around 50% CO2 reduction on average, so in reality the decision to opt for the Tesla is between 12% points of extra CO2 reduction compared to the ICE baseline but 26% more particles.

How robust is this conclusion? In other words, would we get a very different answer if we had chosen a different FHEV/BEV pair of vehicles? From Emissions Analytics’ wider EQUA programme, we have tested many different vehicles for tailpipe emissions and tyres for wear rates. From this we conclude that the key factors in the relative emissions at the whole-vehicle level are the vehicle mass and torque, the model year and the tyres the vehicle is equipped with. Therefore, it is of little significance that the Kia Niro is physically smaller than the Tesla Model Y, as the differences in mass and torque are representative of the typical of choices that consumers are making in today’s market. What this shows is that the vehicle manufacturer’s choice of tyres is increasingly important in overall emissions, both for tyre wear and CO2 via rolling resistance.
What does this mean in terms of the concept of Pareto efficiency set out at the start? Moving from a gasoline ICE to the hybrid would be a Pareto improvement: it is better on every measure. But moving from the gasoline ICE to the BEV is not such an improvement, due to the increase in tyre particles. So, given gasoline ICEs are predominant at the moment, the optimal and most efficient move in terms of scarce resource allocation is to move to FHEVs, not BEVs.
But it doesn’t end there. Tyres don’t just affect the environment in terms of a mass of small particles. Also important are the number of particles emitted and chemicals that leach out of them over time as they settle on soil or in water, as well as the vexed problem of handling end-of-life tyres. A neglected further effect is volatile organic compounds (VOCs) that ‘off-gas’, or evaporate, from the surface of the tyre all the time. Similar compounds are also released from the tailpipe, although they are regulated only as part of a ‘total hydrocarbons’ measure. Which is greater – VOCs from the tyres or the tailpipe?
During the same test above, we measured tailpipe VOCs using Emissions Analytics’ proprietary sampling equipment that allows a full speciation using two-dimensional gas chromatography and time-of-flight mass spectrometry. These VOCs matter as they are a precursor to smog formation and contribute to the secondary formation of particles in the air, as they react chemically. These effects are in addition to the direct health effects, especially for aromatic compounds, which are often carcinogenic in certain concentrations and exposures. Within that group, polycyclic aromatic hydrocarbons (PAHs) and nitro-aromatics are typically the worst.
Large samples from one tyre on each vehicle were also taken and placed in a ‘microchamber’ heated to 20 degrees Celsius, around the temperature of a vehicle certification test, and held at that level for the same duration of the on-road EQUA test – around three-and-a-half hours. The off-gassed VOCs were analysed and quantified, and then scaled up by the relative surface area of the sample to that of all four tyres on the vehicle. The results are shown in the table below.

This shows that VOCs off-gassed into the air from the tyres are about two orders of magnitude greater than those from the tailpipe of the Kia. Adding the tailpipe and tyre sources, we see that the Kia had total emissions less than half of the Tesla’s. This result is driven by the larger diameter and width of the Tesla tyres, despite their being lower profile. These results will be unpacked further in a future newsletter, but for now we can see that they are consistent with the pattern of the regulated pollutants: there is very little coming from the tailpipe relative to tyres.
In this context, the concept of Pareto improvement is reminiscent of the no-harm principle in medicine: primum non nocere. ‘Do no harm’ means taking a step back from an intervention to look at the broader context and mitigate potential negative effects on the social fabric, the economy and the environment. By switching to FHEVs we can create a ‘no harm’ intervention, unlike BEVs. That is not to say that FHEVs emit literally zero, but no additional harm is done and, in fact, improve all aspects. That is also not to say that BEVs and their associated tyres might not improve – they very likely will. At that point, it would then be right to change policy. To the trade-off described earlier – between 26% more particles as the price of 12% points of extra CO2 reduction – no verdict is passed as to whether this is a good trade-off from a policy point of view, but a trade-off it is.
In the meantime, FHEVs are the win-win, do-no-harm option, while BEVs are the win-lose, the vexatious trade-off in a situation of significant technology uncertainty. On this basis, and of Pareto efficiency, until BEVs reach certain performance characteristics, government and industry support should be switched immediately from BEVs to FHEVs to create maximum welfare.

Efficiently wrong
Battery electric vehicles are great. There – we said it. In fact, we have been saying it all along. But are they so great that all competition should be banned?
The danger of fixating on one thing
Battery electric vehicles are great. There – we said it. In fact, we have been saying it all along. But are they so great that all competition should be banned? Or are they great, but with caveats, such that we should foster choice and spread our decarbonisation bets to ensure the best and most certain reduction in carbon dioxide (CO2) emissions? Banning your competitors can variously be described as state-sponsored monopoly, central planning and rent seeking. Ironically, communist China isn’t banning alternatives to battery electric vehicles (BEVs), yet free-market Europe is. Is there any merit in Europe’s current position, and how can this paradox be explained?

One explanation is how the notion of ‘efficiency’ is being misused. Roughly speaking, diesel engines are 30% efficient in converting chemical energy in the fuel into kinetic energy of the vehicle, while a vehicle battery converts around 90% of the energy stored into motion. Much of the difference is in waste heat. In fact, Carnot’s theorem, based on the second law of thermodynamics, shows that a ‘heat engine’ has a theoretical upper limit of efficiency well below 90%. So, the argument goes, as we are short on low-carbon energy sources, how efficiently we use that energy is vital. And electrical motors powered from a battery at 90% efficiency must easily trump a diesel engine at less than – say – 50% efficiency. Therefore, BEVs are a no-brainer and any resources put into any other technologies must be wasted.
This can be encapsulated in the following syllogism: we need greater energy efficiency in road transport; BEVs are more energy efficient; therefore, we must have them.
There are many flaws in this argument. First, we must step back and remember that the aim is to reduce CO2 emissions. Does greater efficiency always correlate with lower emissions? No-one doubts that efficiency is important, but it is everything? On the first question, this is true in many circumstances. For example, if a diesel car delivering 40 miles per gallon is replaced with a new diesel car at 50 mpg, CO2 emissions will fall in the usage phase. Greater efficiency means lower CO2. In contrast, however, as countries increasingly switch from E5 to E10 gasoline – that is, gasoline containing a maximum 5% and 10% of ethanol respectively – the combustion efficiency falls due to the lower volumetric energy density of the fuel, yet CO2 emissions also fall. In this case, CO2 falls despite worse efficiency. What this shows is that efficiency does correlate with reduced CO2, but only necessarily so when all other things are held the same. In the latter case, the type of fuel has changed. Overall, though, it is clear that efficiency and CO2reduction do not correlate as a general statement.
The second aspect to consider is that greater efficiency may lead to reduced CO2 emissions, but with some other effect. Walking, for example, is highly energy efficient and very low CO2 even when undertaken by carnivores, but it’s not going to get you from New York to Los Angeles very quickly. Equally, walking can be efficient, low CO, quicker cheaper, as seen for many short journeys in congested city centres. What this shows is that efficiency is only one of the relevant variables in the decarbonisation equation.
With Dieselgate in mind, there is some validity in the argument that combusting fuel in urban areas needs to be eliminated, and BEVs are the only scalable option to achieve this. However, this idea neglects the significant differences in pollutant emissions between older and newer vehicles. The latest generation of cars, sold since the introduction of the Real Driving Emissions regulation from 2017, sees the average gasoline vehicle emitting nitrogen oxides (NOx) of 11 mg/km (82% below the regulated limit) and particle number emissions of 0.9 x 10¹¹ #/km (85% below), and the equivalent value for diesels of 43 mg/km (46% below) and 0.1 x 10¹¹ #/km (98% below) respectively – data collected from Emissions Analytics’ EQUA test programme. The proposed introduction of Euro 7 will further tighten the limits and, more importantly, will widen the boundaries of the test and cold-start requirements such that these real-world values will fall further.
As a result, modern ICE cars are not the ones causing urban air pollution problems, but rather the earlier, Euro 5 and 6 vehicles. Euro 5 gasoline vehicles average 39 mg/km of NOx (35% below the limit) while diesels emit 806 mg/km (4.5 times the limit). The priority must be to remove these older diesel cars and, whether they are replaced by new internal combustion engine (ICE) vehicles or BEVs, is largely irrelevant. The Ultra Low Emission Zone in London is a big step in this direction, even though it continues to allow many high-emitting Euro 6 diesels into the city, and does not discriminate on vehicle mass. With typical ICE vehicles emitting 67 mg/km of tyre particles, compared to 81 mg/km for equivalent BEVs, there are some downsides to these heavier vehicles. In short, this shows the logical fixation with ‘combustion’ being inherently bad is also wrong. Of course, this fixation is closely related to the efficiency error.

The logical fallacy against combustion is shown by synthetic ‘e-fuels’, where hydrogen and CO2 are removed from the air using low-carbon electricity and then synthesised into, for example, gasoline in such a way that as much carbon is absorbed during production as is released during subsequent combustion. The combustion itself will still be at low efficiency, but the net CO2 will be close to zero and, due to the purity of the fuel, the pollutant emissions can be very low as well. Low CO2, low pollutants, yet inefficient.
So, why don’t we go straight to e-fuels, and bypass the additional problems of material scarcity and dependence on China that comes with BEVs? The answer is that we do not have sufficient low-carbon electricity to power the process. This is where BEV supporters have a point: green electricity is scarce, so we must use it efficiently. However, what they are proposing is swapping one scarcity for another: scarce green electricity for scarce battery and motor components. Scarcity matters, especially where the scarce goods are disproportionately controlled by a limited number of entities, as it leads to them enjoying excessive ‘economic rent’ through using that market position. Building a diversity of supply is a necessary first step, to accommodate growing demand.
While many BEV proponents complain about excessive profits of fossil fuels companies, their vision would recreate the same issues just with different players. More concerning still is that European’s act of giving BEVs a future powertrain monopoly has given disproportionate market control to China. The US has reacted with a major $369 bn dirigiste policy to break China’s control. The EU is now poised to unveil a ‘Green Deal Industrial Plan’ to match this. The trend of ever-freeing world trade is now well in reverse, as countries take an increasingly protectionist and mercantilist approach designed to maximise exports while minimising imports. Had Europe reacted to the need for decarbonisation by playing to its competitive advantage – especially building low-carbon electricity grids – this value-destroying cycle may never have been triggered.
Such an error by European governments, arguably to assuage Dieselgate, has radically polarised the debate. Anyone who doesn’t ‘get’ the BEV story and its efficiency myth is labelled as a climate change denier. Our aim must be to limit the overall negative effect of climate change in the least damaging way. So, let’s consider an alternative, pragmatic path. It’s simplistic, but balances practicality, cost, geopolitics and – not to be neglected – social welfare.

It should be noted that only in the second phase is efficiency the key dynamic. The attraction of this approach is that it helps manage the significant uncertainties and risks in the effectiveness and timing of the stages of decarbonisation. For example, the BEV-led phase could be accelerated or pushed back depending on technological advancements or setbacks. Looked at another way, these stages are necessary if we are not to blow our carbon budget under the Paris Treaty. All are needed. Hybrids only get you so far, but they are here now. E-fuels are net-zero in principle, but not realistic today. BEVs cannot be scaled today without prohibitive cost.
As a side note, hidden in here is a paradox for the BEV lobby: enough green electricity is needed to allow the manufacture and charging of cars to be low carbon, but too much green electricity would enable competitor fuels and powertrains. We should look out for lobbying focused more on powertrain transition than grid capacity building.

In conclusion, BEVs can be great products and will play a significant role in decarbonisation on almost any scenario. But why ban the competition? The argument that efficiency is so much better that we should gamble all our investment on this horse is ill-conceived, costly and risky. It is perhaps just very clever rent-seeking, supported by parts of an excitable environmental lobby. Once efficiency is seen within the proper context of costs, alternatives and negative side-effects, the merits of a diversified, staged, pragmatic transition to a net-zero world become clear. BEVs then can be best understood as a transitional technology to a fully decarbonised, competitive, welfare-maximising future.

The light duty vehicle to nowhere
The evidence clearly points to using full hybrid electric vehicles (FHEVs) as the best route to rapid, low-risk decarbonisation of cars and vans for the next decade. FHEVs cannot deliver the biggest aggregate reduction in principle, but with scarce battery resources and higher manufacturing carbon dioxide (CO2) emissions of battery electric vehicles (BEV), FHEVs can deliver more CO2 reduction now, and potentially for some time to come.
When will the battery electric vehicle consensus break?
As regular readers of Emissions Analytics’ newsletter will know, the evidence clearly points to using full hybrid electric vehicles (FHEVs) as the best route to rapid, low-risk decarbonisation of cars and vans for the next decade. FHEVs cannot deliver the biggest aggregate reduction in principle, but with scarce battery resources and higher manufacturing carbon dioxide (CO2) emissions of battery electric vehicles (BEV), FHEVs can deliver more CO2 reduction now, and potentially for some time to come. As the evidence for this is strong, yet the argument is losing traction, we wanted to explore the paradox.

Perhaps the answer is that – for now – BEVs work for everyone. The buyers are early-adopters, excited by the prospect of an iPad-on-wheels. Industry is embracing the opportunities for disruptive innovation, competitive advantage and reputational gains, encouraged along by the incentive to avoid fleet average CO2 fines. Environmental groups, broadly, are taking the position that fewer private vehicles are desirable, but, to the extent they are needed, at least BEVs are 'zero emission.’ Governments are appreciating an apparently simple policy position to reduce climate change, solve air quality and extinguish the smell of Dieselgate in one go.
Reviewing the facts, let us look at the data, all from Emissions Analytics’ independent testing and modelling:

References:
1. Super Size EV Automotive's obesity crisis
2. Schrödinger’s Car
3. Cutting pollution and improving public health
4. The septillion particle problem (literally)
5. Gaining traction, losing tread Pollution from tire wear now 1,850 times worse than exhaust emissions
These figures are based on facts today for the developed world, rather than future scenarios and projections, except for a forward trajectory of decarbonisation of the electricity grid, which is a highly likely trend despite Europe reopening coal power stations for this winter. The conclusion can only be that it is a mixed scorecard: BEVs cut CO2 emissions by 19% compared to FHEVs (and by more than half compared to traditional ICE) at the price of being bigger, heavier and more expensive, plus some elevated non-exhaust emissions such as tyre wear. Even though they are non-zero, hybrid emissions are all substantially under the regulatory limits. Furthermore, the table does not include the utility limitations of BEVs, and the increasing danger to other cars in accidents, owing to the mass.
Ordinarily, such a mixed scorecard would lead to a mixed market of BEVs, FHEVs and internal combustion engine (ICE) vehicles, where the needs and means of different buyers are matched to the available products. If pollution externalities were also internalised through appropriate taxation, that market could also reach an efficient equilibrium. Currently, however, policy is simply seeking to ban alternatives to BEVs based on a false ‘zero emissions’ promise.
The issue is not just that the emissions reductions of BEVs are not as big as billed, but that most people will not be able to afford BEVs at these prices. In 2022, prices have gone up owing to inflationary pressure on battery materials. The suggested BEV:ICE price parity point of $100 per kWh was meant to have been reached by now, but has been put back to mid-decade at least. More widely, average real incomes in the developed world are under pressure. So, this policy is likely to price people out of cars. Maybe this is the point?
One hypothesis to consider is that policy makers are fully signed up to the argument that private transportation is the main source of environmental ills, and therefore must be curtailed. Groups such as the European Institute of Innovation and Technology Urban Mobility Initiative say, “We want to see a massive shift. We want fewer cars”. While this may be beneficial in congested and networked cities, it is harder to argue elsewhere. For those against cars on principle, not only could higher purchase prices be welcome, but also range anxiety, usually billed as a negative, may actually be a good thing if it reduces vehicle miles driven, helped out by insufficient charging infrastructure. FHEVs do not fit the mould because they are not zero emission, have no range anxiety, and they are hardly more expensive that traditional ICE vehicles, so do not discourage private driving.
Taking the policy argument further, reducing private transportation may also ameliorate problems of congestion, and the associated pressure to spend on road expansion. Increasing public transport usage would go some way to resolving the economics of buses and trains, which have always been a challenge outside of dense urban centres, and which were rendered dire as a result of Covid. In this way, some governments are attracted by anti-car arguments of certain interest groups.

In support of this hypothesis, consider the proposed Euro 7 emissions regulations. Why is so much effort and priority being put into a regulation for making pretty clean tailpipes a bit cleaner? It is inevitable that the effects of the regulation will be to make ICE vehicles more expensive, and close the price gap with BEVs. Even setting aside hybridisation, if we were serious about getting rapid emissions reductions, the unequivocal number one policy objective would be to get older ICE vehicles replaced with the latest ICE models, which have much lower emissions. Making new vehicles more expensive impedes this process.
The alternative hypothesis is that cheaper BEVs will come to the market to maintain mass private mobility. Such cars, with lower price premia over equivalent ICE vehicles, are already coming to market, such as the MG range. Other manufacturers, such as Volvo, are making rapid shifts towards all-electric ranges, while new entrants such as BYD are arriving. What is common between many of these is that they are Chinese owned – MG by SAIC and Volvo by Geely. China’s current powerful position in mining and refining battery and electric motor materials, together with its lower labour costs and state subsidies, allows it to price vehicles at a level that rivals cannot match in the market. This competitive advantage is then being used to expand along the value chain into finished car manufacturing and assembly, branding and sales. By the time developed countries have built their mining and refining infrastructures, China is likely to have captured a significant proportion of worldwide automotive economic value, finally usurping Europe, the US and Japan’s historical leadership in engine and hybrid technology. It is even quite likely that most of this infrastructure will never be built, as the competitiveness of China in part rests on its willingness to pollute air, soil and water through its manufacturing more than would be acceptable elsewhere. In this case, visibility of and control over the supply chain and, by extension, product lifecycle CO2 emissions would be restricted, so targeting it meaningfully would be difficult.
So, when it comes to the choice between curtailing private mobility and ceding significant economic value to the Chinese, the current BEV consensus may start to fall apart. Even then, some will prosper. Premium European manufacturers may be able to make more profit, even on lower sales volumes, by going up-market with highly innovative eco-flagships. Those of significant personal means or without the need to travel for work, may find the lower level of economic activity and congestion attractive. Governments may be happy if air quality targets are met. But the general population, reliant on private transportation for day-to-day life, may find themselves colliding with their governments. What feels like a win-win BEV policy now, may rapidly turn into a lose-lose for Europe.
Looking at the latest new car sales figures in the UK, there is evidence of what the revealed preference of the car-buying public might be. The share of FHEVs has risen to 11.6% over the last six months compared to 9.9% in the previous period, while the BEV proportion fell to 14.1% from 16.4%, despite on-going retail subsidies and hidden subsidies through emissions regulations. However, the trend is quite variable, and this is more likely to be just a pause, with all the investment by manufacturers into BEVs and the large pipeline of products about the hit the market.
Ultimately, there is only one way really to solve the greenhouse gas emissions problem: nuclear energy as substantial baseload electricity on top of which cheap and clean, but intermittent, wind and solar power can prosper. When you have a world economy and society built on the plentiful energy of fossil fuels, the only way to transition away is to an alternative plentiful fuel supply. As we need to do it as quickly as possible, we can only use existing nuclear fission technology, although this includes innovations such as small modular reactors. If we do this, many options become possible, that can compete in the market against one another: green hydrogen, synthetic liquid fuels, ammonia, methanol, battery vehicles, and so on.

While we scale up the nuclear energy industry, which will take a few decades, it may be simpler and more effective to taxi gasoline and diesel more, to compensate for as much of the environmental externality as possible, consistent with preserving widespread private mobility. Pushing for BEVs is an expensive way to discourage travel, with a huge deadweight cost of forcing a largely unnecessary change in powertrain. It also sets up future geopolitical grief, as powerful fossil fuel interests are swapped for powerful mining and refining interests. However, for a while, governments will like the policy because it paints a simple, compelling net-zero story – until their electors realise the actual costs and consequences.
Emissions Analytics will continue to bring independent data to inform this evaluation, updating it as new information arises. We are neither pro nor anti bicycles, walking, horses, skateboards, flying, biofuels or Hummers in themselves. What we are in favour of is actually reducing emissions, rather than virtuous noise. Yes, there is a value to policies that are simple to communicate, but not if they do not work.

Super Size EV Automotive's obesity crisis
Leading international vehicle emissions testing company, Emissions Analytics, today launches an innovative tyre database, the product of over two years of testing and evaluation.
The automobile has given society a major benefit in mobility, at the cost of an environmental impact which is now seen as unsustainable. There are now around 1.5 billion cars on roads around the world, coming in many shapes and sizes, and being put to a panoply of uses. While pollutant emissions have to a significant extent been solved on the latest internal combustion engined vehicles in developed economies, this is not true of the main global warming gas, carbon dioxide (CO2). To address this, battery electric vehicles (BEVs) are being pushed by a particularly vocal group of influencers, as if they are a panacea. Joining this call are governments from the world, which may make their takeover inevitable.
But: when the problem is the environment impact of mass mobility, we need to ask ourselves whether encouraging vehicles that are on average 39% heavier, 40% bigger and 44% more expensive to buy than normal gasoline internal combustion engine (ICE) cars is really the immediate answer.

The size issue is not confined to BEVs. Gasoline SUVs, of which there are over 200 million in the world, are 27% heavier than smaller, gasoline hatchbacks, as shown in the graph below. This shows how the kerb weight – i.e. the vehicle empty but with a full tank of fuel – averaged over all new vehicles on sale in Europe has changed over time. In our last newsletter, Gaining Traction, Losing Tread, we set out the issue of tyre wear emissions, which shows that weight matters for environmental pollution. The excess weight of BEVs is likely to lead to 8.6 mg/km of additional tyre particulate mass emissions, and gasoline SUVs an excess over hatchbacks of 5.3 mg/km, both above the total maximum permitted total tailpipe particulate emissions of 4.5 mg/km.

Looking at the trend in average vehicle weight in different categories over the last twelve years, collated from manufacturer data, we can see the clear rising trend for BEVs, as large SUVs have come to dominate a category that started with smaller hatchbacks and saloons. The weight of gasoline SUVs has stayed relatively constant, but market share has shifted in their direction.
Put in a longer historical context, European vehicles became almost 500 kg lighter in the decade after 1997 as small city cars proliferated and, further back, US cars became 400 kg lighter in the five years from the 1973 oil crisis. Therefore, a growing waistline is not predestined.
So, why are vehicles getting bigger and heavier? There are three reinforcing trends. First, consumer preferences appear to be shifting in favour of large, high-riding vehicles, with Europe catching up with earlier trends in the US. Second, more safety equipment and designs have been deployed in response to legislation and consumer pressure. The third factor is regulation, which has, perhaps unintentionally, accelerated the trend. In the US, larger pick-up trucks are exempt from the corporate average fuel economy rules, and there is a ‘footprint’ adjustment that gives easier targets for physically larger vehicles. In Europe, there is a similar adjustment to the CO2 targets, giving easier targets to heavier vehicles. More generally, the deployment of more exhaust after-treatment technology to meet ever-tighter pollutant emissions regulation has required more physical space on the vehicle and higher prices to maintain profit margins. In simple terms, CO2 emissions have been increased to serve consumer preference and air quality gains.
Along with the added weight of BEVs and gasoline SUVs comes greater physical size. The average BEV from the last five years is 44 cm longer, 9 cm wider and 33 cm higher than the average gasoline vehicle. This equates to an excess volume of 40%. This has positives in terms of consumer utility where it leads to greater interior space and better access, but may come with downsides in terms of on-road practicality and safety. According to an estimate from the US, if you are hit by a vehicle 450 kg heavier than yours, the risk of death is 47% greater than if the vehicles were of the same weight.
With this extra size and weight typically comes higher CO2 emissions, whether that is from the manufacture of the vehicle or during usage. Plotting the real-world tailpipe CO2 emissions against weight, from Emissions Analytics’ EQUA test programme of hundreds of vehicles using Portable Emissions Measurement Systems since 2011, we see a positive correlation: each extra 100 kg of vehicle mass adds on average 13.9 g/km to in-use exhaust emissions, as shown in the chart below. This is likely to underestimate the relationship as vehicles have become more fuel efficient, like-for-like, over time. If weight is correlated to the official CO2 values over just the last five years, an extra 100 kg of mass adds 24.6 g/km.

If we add in estimates for upstream CO2 emissions from the vehicle manufacture, fuel refining and electricity production – using Emissions Analytics’ proprietary lifecycle analysis (LCA) model – we can see the total distance-specific emissions over a vehicle lifetime in the table below.
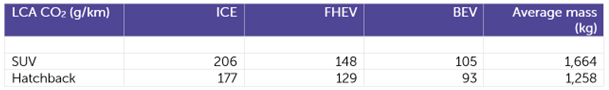
For further details on the model and methods, please refer back to our previous newsletter: Schrödinger’s Car.
The table shows, on these assumptions, that BEVs deliver the largest reduction in CO2 – roughly halving the emissions of the equivalent ICE vehicle. However, if we were to revert to the previously most popular bodystyle, the hatchback, and applied the latest hybridisation, using less than 2 kWh of battery, battery electric SUVs are 19% lower in CO2 emissions, due primarily to the difference in vehicle mass.
But this is not the end of the story, as with greater size and weight also comes higher purchase prices. In 2022, the average list price of BEVs on sale in the UK is £37,003, compared to £25,771 for gasoline ICEs. Full hybrids (FHEVs) – those with the capability of some driving on battery only but without the possibility of external charging – cost on average £25,745, but the hatchback subset of these comes in at just £17,577.
The risk, therefore, is that, without significant taxpayer subsidy, consumers will hold back from buying BEVs. This is perhaps being seen for the first time in the softening market share figures for BEVs in the first quarter of 2022 in the UK and Europe. This in turn may lead to consumers buying new ICE vehicles, but many will be put off by the threat to residual values and utility of looming statutory bans. Instead, many may simply opt to hold onto their existing ICE vehicle or buy second-hand, keeping them on the road longer than normal.
Currently, 14 years is the average lifespan of a vehicle in Europe. If this were to increase due to the high price of BEVs, it would covertly undermine the CO2 reduction of BEVs until all the ICE vehicles were off the road. Taking the UK car parc of around 32.5 million vehicles and a typical number of new car transactions of around 2.1 million per year, we can model three scenarios: reverting to 100% gasoline ICE vehicles, shifting all new cars to BEVs by 2030, and shifting exclusively to FHEVs at the same rate.
Although current new car sales are running at 1.6 million per year due to a combination of the economic environment and supply chain disruption, we have assumed a reversion to the usual level of 2.1 million per year soon. We can assume that a switch to FHEVs would not affect the quantity demanded as the average price is similar to an ICE vehicle. The question is the degree to which, other things being equal, the quantity of BEVs demanded would be affected by their higher relative price. According to recent research from Norway, the price elasticity of demand for BEVs is -1.27, i.e. demand falls by 1.27% for every 1% increase in price. If we further assume that 41% of car buyers are actively considering a BEV in the next five years, this would imply a reduction in sales of up to 480,000 per year due to the price premium. In other words, sales could remain subdued at around 1.6 million per year rather than recovering. Countering this argument would be the valid point that BEVs are cheaper to operate, although consumers tend heavily to discount future benefits.

With a lower level of new car sales, but assuming no reduction in demand for car usage, the average lifespan of a vehicle would likely increase. According to Emissions Analytics’ model, that increase would be from 14 to 17 years on average. On a lifecycle basis through to 2050, the effective fleet average CO2 emission on the base ICE scenario is 223 g/km. On the BEV scenario, this falls to 156 g/km. The FHEV scenario would be 181 g/km, but if these FHEVs were exclusively hatchbacks it would be just 158 g/km on average. These values lead to the cumulative CO2 figures through to 2050 in the chart above. Therefore, given the current realities of BEV pricing, and accepting the compromise in utility from a hatchback, a strategy of hybridisation is just as good as an immediate BEV migration, but with the benefit of needing less taxpayer support.
This analysis of course takes the specifications and prices of current vehicles. The only future forecast used is around the forecast decarbonisation of the electricity grid. If BEVs and SUVs become relatively lighter or cheaper over time, or the CO2 intensity of manufacture or energy production falls, different conclusions would be drawn. Therefore, for BEVs to be the optimal way forward that is often proposed, focus needs to be on addressing these factors affecting CO2, rather than subsidising the uptake right now. Finally, we must also recognise the on-going CO2 reduction benefits of BEVs after 2050 compared to FHEVs, which holds so long as battery durability matches the current lifespan of vehicles, which was discussed in our previous newsletter, Why battery durability matters for decarbonisation.

All in all, for the next decade, is it not better to incentivise smaller, hybridised vehicles as a more efficient, lower-risk and intuitive solution to CO2 emissions? Surely urban environments would be more pleasant with small, light vehicles moving around than the “electric tanks” quoted by Neil Winton in Forbes. Surely, this would also help preserve the affordability of vehicles for a wide population? Should vehicle weight even be regulated, as a good proxy for low emissions and high CO2-reduction efficiency? Such an approach may even be a way to reinvigorate EuroNCAP crash safety ratings that according to some now focus so much on the presence of driver safety aids of debatable efficacy.
It is true that such an approach would be crimping people’s liberty to some extent, by incentivising people to forgo the trappings of big SUVs. However, all directions in environmental improvement require some compromise, and this may be a smaller compromise than the available alternative options. This would be a dramatically different, and potentially much more effective, route to environmental improvement than the combination of fleet average CO2 targets and the proposed Euro 7 emissions regulations that seem destined to super-size the car parc in an unhealthy.

Why battery durability matters for decarbonisation
Lifecycle carbon dioxide (CO2) modelling of battery electric vehicles (BEVs) typically relies on the critical assumption that the battery lasts the lifetime of the vehicle, which is around 14 years.
Are policy priorities correct?
Lifecycle carbon dioxide (CO2) modelling of battery electric vehicles (BEVs) typically relies on the critical assumption that the battery lasts the lifetime of the vehicle, which is around 14 years. However, we know that battery capacity declines over time, and manufacturer battery warranties tend only to cover the first eight years. What if battery packs last a shorter time than expected, requiring replacement during the vehicle lifetime or even leading to early scrapping of the vehicle? How would that affect the lifecycle CO2 of BEVs and impact, at the overall car parc level, our ability to achieve ambitious climate change goals.

Almost two-thirds, typically, of CO2 emissions in the manufacture of a BEV are associated with the battery , including sourcing raw materials. For an internal combustion engine (ICE) vehicle, even a mildly hybridised one, that fraction is less than 5%. Therefore, the life expectancy of the BEV battery pack is clearly crucial to the vehicle’s overall CO2 footprint – and residual valuation – in a way that is not true for primarily combustion cars.
Emissions Analytics has previously reasoned that the best route to decarbonisation for at least the next decade is to pursue a path of mass hybridisation. This is primarily due to the scarcity and cost of battery materials, which is now being seen as a result of accelerating demand and supply chain constraints. A further reason is the risk around consumer acceptance of BEVs at retail prices that are profitable for manufacturers. The argument is set out in more detail in a previous newsletter. The analysis uses a proprietary lifecycle model created by Emissions Analytics, based on a meta study of academic literature and information from manufacturers. The key input assumptions are set out in that previous newsletter – of note is that it is assumed that the grid is decarbonised by 50% from 2030, but manufacturing emissions remain constant. Battery life is assumed at eight years by default for our purposes here, reflecting manufacturer confidence levels as revealed by warranty durations.
In this newsletter, we compare three different vehicle sales scenarios: an ‘ICE baseline’ scenario with 50% gasoline and 50% diesel vehicles; a ‘BEV transition’ model with 75% BEVs in 2031 and 100% in 2035; and a ‘Hybrid strategy’ with 100% full hybrids (FHEVs) throughout.
The clear conclusion is that, in 2050, the deadline for net zero emissions for many countries including the UK, the cumulative CO2 emissions from the manufacture and usage of vehicles is similar whether we go for the direct BEV transition or the Hybrid strategy, as shown in the chart below.

Compared to the ICE baseline, the direct BEV transition reduces CO2 by 1% more than the Hybrid approach. The chart makes it clear how important electrification, generically, is to reducing CO2 from transport, but it raises the question whether the additional gains from the pure BEV model warrant the investment required – that investment not just being subsidies, tax incentives and government infrastructure investment, but also by the car buyers themselves due to higher purchase prices. This timespan, however, does not bring out the longer-term benefits of BEVs, which can be seen if we look at annual, rather than cumulative, reductions in CO2, as shown in the chart below.

As a result, after 2050, the cumulative advantage from the BEV transition gradually widens as old ICE vehicles drop out of the parc and the lower in-use CO2 of BEVs comes to the fore. By 2070, the lead in cumulative CO2 emissions of BEVs has reached 9% over the Hybrid strategy, and a full 34% compared to sticking entirely with ICE vehicles. This is a significant reduction, but 49.2 megatonnes of CO2 still come from an entirely BEV parc in one year – hardly “zero emission.”
If the assumption around an eight-year battery life is then flexed, we can see that it has a significant impact on the end result of electrification. If, in practice, batteries last on average as long as the chassis – 14 years – then by 2050 the BEV transition scenario would deliver 13% points more CO2 reduction than with eight-year battery life, a figure that rises to 16% points by 2070, as shown in the chart below. So, in 2070, the 9% CO2 reduction from faster BEV penetration over the Hybrid scenario is dominated by an additional 16% that could come from better battery life.

So, we conclude that, as long as we urgently electrify – whether BEV, PHEV or FHEV – we will achieve significant, and similar, CO2 reduction by 2050. Additional penetration of BEVs delivers extra CO2 reduction only after 2050, and it comes at a cost and with execution risk. Improving the lifespan of batteries makes a bigger difference to CO2 emissions in particular by 2050. Therefore, this suggests that policy needs to be more attentive to the quality of the current generation of BEV products than simply the number on the road.
In a pessimistic scenario where batteries only last on average of six years – which would be costly both in terms of CO2 and to the underwriters of manufacturer warranties – the Hybrid strategy would be 10% better in 2050 than the BEV transition, and still be better, by 6%, in 2070, as the constant renewing of batteries outweighed the lower in-use emissions of BEVs. This is not a likely scenario, but makes plain the sensitivity of our decarbonisation policy to a complex and opaque piece of engineering produced by the private sector.
It could be argued that recycling batteries would mitigate the problem of poor durability, and shift the evaluation more in favour of BEVs. While this might become true in the future, the recycling infrastructure does not yet exist at scale and the energy required to separate the chemical components, clean them up and then assemble into a new pack is also significant. It is currently unclear whether the saved mining emissions is greater than the CO2 overhead of the recycling. A further criticism of this analysis might be that the CO2 in manufacturing both the car and battery does not reduce over time in the model. This may happen, but is not certain. Equally, no benefit from reducing emissions from liquid fuel production, or the use of biofuels or synthetic fuels has been assumed.
So often, when talking of decarbonisation, the dates mentioned seem far in the future. Using the same model as above, we can make the numbers real and immediate by tracking the CO2 reductions since the start of 2020. Emissions Analytics compiles its “CO2 totaliser”, which compares the cumulative CO2 emitted by cars sold since January 2020 under our current BEV transition policy against the two alternative scenarios. The first comparison is to a car market that remains 50% diesel and 50% gasoline ICE. The second is to a market completely made up of FHEVs. The early moves by the UK into BEVs has currently led to more CO2 emissions than on both these alternative scenarios

The 3.3 million vehicles sold in the UK since January 2020 emitted in total 6.153 megatonnes more CO2 than would have been the case if all vehicles sold had been full hybrids, which typically have batteries between 1.5 and 5.0 kWh in capacity, and 2.360 megatonnes more than if all vehicles had an ICE. This is not surprising as BEVs – with batteries typically between 60 and 100 kWh – have much higher emissions from the manufacture, which is then offset by lower emissions during use. This makes plain that calling BEVs ‘zero emission’, solely because they have no tailpipe, is a nonsense. The surplus CO2 is even greater compared to a market made up only of FHEVs, because they have manufacturing emissions only slightly higher than ICE vehicles, but around 30% lower in-use emissions.
The annual CO2 budget for the UK is approximately 700 megatonnes, based on consumption emissions and including aviation¹. This value contrasts with territorial emissions, which only measure CO2 arising from activity in the UK – this is particularly relevant where a high proportion of vehicles are manufactured overseas. Around 27% of total emissions are from transport² and, therefore, the 6.153 megatonnes excess accounts for around 1.6% of total transport emissions.
In summary, with shoulders firmly to wheel of BEV rollout, lubricated with a flow of taxpayer subsidy, it would be right to tally up whether the approach is leading, or will lead, to significantly reduced emissions. In a market dominated by BEVs, we must be conscious that the dominant element of CO2 emissions is likely to become the replacement of batteries rather than the energy required to propel the vehicle. This supports the idea that policy should perhaps focus more on the longevity and durability of these batteries, rather than a singular focus on BEV market share. We have consciously simplified the options to illustrate this underlying point, including not factoring in the potential for PHEVs due to the sensitivity of their emissions to user behaviour.
After all, the aim is surely to reduce CO2 emissions and slow global warming, rather than to promote BEVs as inherently better products – if they were so superior, they would not require subsidy at all.
The inevitability of hybridisation?
While the direction of vehicle powertrain policy and strategy is firmly oriented towards full battery electric vehicles (BEVs), the results of Emissions Analytics’ latest testing and lifecycle modelling suggests that hybridisation may prove to be the dominant outcome, whether intended or not.
While the direction of vehicle powertrain policy and strategy is firmly oriented towards full battery electric vehicles (BEVs), the results of Emissions Analytics’ latest testing and lifecycle modelling suggests that hybridisation may prove to be the dominant outcome, whether intended or not. As real-world emissions results collide with consumer preference and fiscal reality, the efficiency of hybrids in reducing carbon dioxide (CO2) emissions is likely to shine through over the next decade, even if BEVs and other new technologies come to dominate in the longer-term.
Put another way, at the moment it appears that battery electric vehicles (BEVs) are neither sufficiently clean nor a strong enough consumer proposition to achieve mass adoption without significant subsidy. They are certainly not zero emission, not least due to the construction process and tyre wear emissions. Hybrids, in contrast, reduce tailpipe CO2 emissions materially now – albeit somewhat less than BEVs – and have few utility disadvantages for consumers. Therefore, would it be optimal to follow a hybridisation strategy for, say, the next ten years and then segue to BEVs after that, once they are cleaner and have fewer consumer disadvantages?

The typical objection to this is that BEVs already in the fleet will automatically become cleaner as the grid decarbonises. While this is true, the greatest source of CO2 from BEVs is in the manufacture, which is fixed and incurred upfront. Therefore, every BEV manufactured now may crystallise enough CO2 today to outweigh the subsequently lower CO2 of operation, compared to typical hybrid vehicles.
Taking the latest sales figures for new cars from the UK’s Society of Motor Manufacturers and Traders (SMMT), and putting them together with recent test results for exhaust and non-exhaust emissions from Emissions Analytics, it possible to evaluate the progress in decarbonisation.
Before turning to CO2, it can immediately be seen that BEVs deliver little overall advantage for air quality. While NOx emissions remain positive for internal combustion engines (ICEs), the levels are significantly lower than for earlier models. This is true to the extent that, if the car fleet were made up entirely of these latest diesel and gasoline cars, there would be no air quality legal violations. For particle mass emissions, exhaust filters on ICEs typically reduce emissions to less than 1 mg/km. In contrast, tyre emissions from ICEs are around 32 mg/km over a lifetime, whereas the BEV tyre wear rate – other things being equal – are 21% higher at 38 mg/km. Adding exhaust and non-exhaust emissions together, BEVs are slightly higher emitting than ICEs and full hybrid electric vehicles (FHEVs).
With BEVs not required for air quality compliance, their primary environmental purpose is CO2 reduction. The table below estimates the CO2 emissions saved compared to the benchmark gasoline ICE for each alternative powertrain, based on 16,000 km of annual driving and the latest market shares of each. The greatest aggregate CO2 reduction is from BEVs, which have 8.4% market share. Hybrids, collectively, with 34.0% market share, account for around three-quarters of the reduction of BEVs.

These BEVs include around 5.5 million kWh of battery capacity, compared to 1.0 million kWh in all the hybrids together. Therefore, for every kWh of battery capacity, BEVs delivered 3.0 g/km of CO2 reduction, compared to 13.7 g/km for hybrids, both judged against the gasoline ICE benchmark. In other words, hybrids have been 4.6 times more efficient at reducing CO2 as a function of the currently constrained battery material supply.
Had the battery material from the 92,420 BEVs sold been used in hybrids – assuming average battery capacities of 60 kWh and 2.6 kWh respectively – an additional 2.1 million hybrids could have been built, enough to cover all new cars sold in the whole of 2021 in the UK. In that hypothetical scenario, the CO2 reduction from the annual operation of the hybrid vehicles would be 940 kilotonnes greater than from the BEVs.
To analyse more fundamentally the differences between the powertrains, it is necessary to consider lifecycle CO2 emissions, including vehicle manufacture, operation and end-of-life processing. To that end, Emissions Analytics has developed its own proprietary model; for the purposes of this analysis the key assumptions are:
15-year, 175 km vehicle lifespan
60 kWh BEV battery size
150 kg/kWh of CO2 in battery production
300 g/kWh of CO2 for BEV charging.
Considering the cumulative CO2 emissions to 2070, it is possible to compare six different scenarios as shown in the table below. The three powertrain scenarios are an ICE-led baseline, a direct migration to BEVs, and an interim switch to FHEVs until 2030 and then migration to BEVs. Each of these scenarios has two versions: one calculated based on current CO2 intensity of electricity generation and BEV manufacture, the other with that intensity reducing by 50% from 2030.

The reason for BEVs being hardly better than FHEVs on current CO2 intensity is that the manufacture emissions of the vehicle and battery are still relatively high, and the average grid electricity across Europe still includes significant gas and coal.
Therefore, we can deliver an extra 8% point reduction in CO2 compared to the baseline by switching straight to BEVs, if a 50% reduction in CO2 intensity is achieved from 2030. According to the fifth carbon budget under the UK’s Climate Change Act, the country can emit 1,725 million tonnes of CO2-equivalent between 2028 and 2032. The added benefit given by the direct migration to BEVs is over 10% of that carbon budget – which demonstrates how every percentage point of reduction in CO2 is important.
On the surface of this analysis, BEVs look like the optimal strategy, even though the gap to the FHEV strategy is closer than reported elsewhere. However, this neglects consideration of risk. Rolling out hybrids would be relatively low risk due to limited resource requirements, consumer resistance and taxpayer subsidy requirement. Furthermore, the BEV estimates of CO2 reduction are sensitive to many factors, including:
Speed and degree of decarbonisation of battery and vehicle manufacture
Speed and degree of decarbonisation of the grid
Improvements in battery energy capacity and therefore vehicle range
Longevity of batteries and BEVs as a whole
Geopolitical security around scarce battery materials
Environmental and ethical issues around mining
Degree to which vehicle miles travelled in BEVs replace ICE miles, or are additive due to the lower marginal cost
Ability to develop a transparent and standardised lifecycle model to be able objectively to verify CO2 reduction claims.
Each of these could have a material impact on the analysis and resulting CO2 reduction, both positively and negatively. However, as high-certainty methods of CO2 reduction are a pressing policy need, it may be better to ‘bank’ the lower-risk 24% reduction from ten years of hybrids, and then migrate to BEVs and other lower-CO2 powertrains.
Returning to the topic of currently scarce battery materials, the FHEV strategy requires 39 GWh of battery capacity for vehicles sold in the ten years to 2030. In contrast, the BEV strategy requires 570 GWh, or 15 times more. From a practical, ethical and geopolitical point of view, this is significant.
There is, further, a paradox with BEVs: once bought, from a CO2 point of view it makes sense to drive them a lot so the embedded emissions in the construction can be amortised across the maximum usage. It may even be better to drive incremental miles in the car rather on some forms of public transport. This is, therefore, linked to the question of taxing BEVs such there are no perverse incentives to drive on the road more, and creating replacement revenues for the declining taxes on gasoline and diesel.
Putting together this rate of CO2 reduction and the current utility compromises, it suggests that BEVs are not yet good enough value a product to get rapid adoption without significant subsidy. With new internal combustion engines now sufficiently clean that they are not contributing to air quality violations and the readily available alternative in hybrids, it appears that the optimal policy is to concentrate on them for the coming years while BEVs and other low-CO2 powertrains get ready for mass adoption. Greater competition would be good for consumers in the long term, especially where greater proportions of the added value in the vehicles arise domestically, whatever the country. Vast sums of taxpayer subsidy – billions, if not tens over billions, of pounds over time – could also be avoided.

Failing this, it is likely that we end up at hybridisation by another route: at the household level. This is because consumers may hold on to old ICEs to cover longer journeys, heavier payloads, sporty driving and the like. These older vehicles may also have higher NOx emissions, being Euro 6 prior to the introduction of Real Driving Emissions, or earlier. Governments may try to force these off the road through higher taxation, but this is unlikely to work as the low depreciation rates of these older vehicles will make for cheap motoring in almost any scenario.
In summary, surely it would be better to take the pragmatic route and hybridise everything as soon as possible?
This conclusion is not dissimilar from that articulated in a facsheet from the International Council on Clean Transportation in July 2021, which said, "Hybridization can be utilized to reduce the fuel consumption of new internal combustion engine vehicles registered over the next decade, but neither HEVs nor PHEVs provide the magnitude of reduction in GHG emissions needed in the long term."
But, the numbers suggest we replace "can" with "should", to lock in the CO2 savings now.
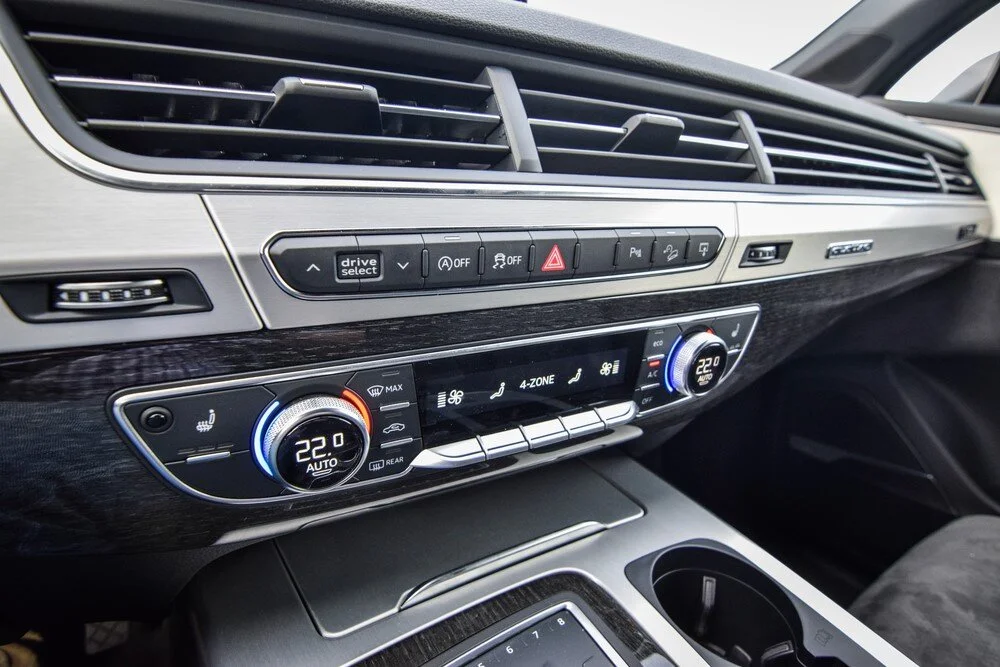
From performance to experience
Could vehicle interior air quality become the differentiator of the future?
Cars used to be about speed, power, performance and freedom. Different models often used to offer dramatically different performance and looks.
Could vehicle interior air quality become the differentiator of the future?
Cars used to be about speed, power, performance and freedom. Different models often used to offer dramatically different performance and looks. But, not so any more. We are currently in an era of the generic sports utility vehicle (SUV) and identikit low emission vehicles. Electric vehicles “all look alike”, as suggested by the head of BMW recently¹.
But can this last? Will consumers want to buy such seemingly bland offerings, and can manufacturers profit from the undifferentiated? Perhaps we are already beginning to see early signs of a shift. Electrification may turn out to be less about emissions reduction, but rather emblematic of the change in the fundamental proposition of the car away from performance and towards experience. Performance is increasingly constrained through traffic and emissions policy, so consumers may want to make the increasingly dull experience of driving at least more comfortable.
Historically, operating a car delivered ample private benefit and enjoyment, at the expense of an alarming array of environment and health impacts: climate effects through carbon dioxide (CO²) emissions; air quality from tailpipe nitrogen oxides (NOx), particulates and carbon monoxide (CO); air and marine pollution from tyre and brake wear; ozone formation from evaporation of volatile organic compounds (VOCs) from fuel in the tank and construction materials; and noise and many others.
Battery electric vehicles (BEVs) are perceived to be the antidote to this: quiet and pollution free. This is of course not quite true: BEVs create CO² emissions in their manufacture, some noise and perhaps higher tyre wear emissions. Nevertheless, we could get to the point where the environment affects the BEV driver more than the BEV affects the environment.
How could this be true? Road transport collectively is only a minority contributor to air quality problems in 2019 – perhaps only 12% of particles² and 33% for NOx³. The majority of pollution comes from domestic heating, industrial sources and agriculture. This polluted air can enter the vehicle cabin through its ventilation system, exposing the driver to the resulting health risks and discomfort. Therefore, it may well become increasingly the case that the car driver is more a victim of pollution than the cause.

Even without BEVs, there are already some aspects of the internal combustion engine (ICE) which foreshadow this trend. First, due to the efficacy of exhaust after-treatment systems, the levels of CO and NOx are so low in real-world operation that the impact on the environment is negligible. For example, under the latest European Real Driving Emissions (RDE) regulation, the average real-world emissions are 157mg/km from gasoline vehicles and 36mg/km from diesels for CO; and 9mg/km from gasolines and 45mg/km from diesels for NOx. Second, as demonstrated previously by Emissions Analytics, diesel particulate filters (DPFs) are so efficient that there are often fewer particles coming out of the tailpipe than there are in the air of a polluted city such as London⁴.
With this background, consider the scenario where the powertrain element ceases to be a major differentiator between mainstream BEVs. Power may be limited to maximise range, torque could be capped to reduce tyre wear emissions, and tyres may become skinnier to reduce rolling resistance but at the cost of handling. As and when connected and autonomous vehicles hit the road, this pattern may become even more pronounced. Furthermore, the cost of electricity – as low as three cents per kilometre – could mean the operating costs become almost irrelevant. Mainstream cars cease to have a performance dimension. Add to this the relatively few standardised manufacturing platforms and you have vehicles of increasingly similar performance. In this world, how will manufacturers differentiate their products and make decent profits?
Design undoubtedly will remain a key element, both for aesthetics, build quality and cost. Beyond that, with the background of historical air pollution problems and now Covid-19, it may well become the vehicle interior air quality that becomes a major differentiator. What once were major sources of pollution, could now become protective automotive bubbles.
Tesla’s launch of its ‘Bioweapon Defense Mode’ in 2016 was perhaps early evidence of this trend. The data presented by the company for its efficacy involved exposing a vehicle to high levels of particle pollution in an emissions chamber and showed that concentrations of particles by mass⁵ in the vehicle cabin fell from 1,000ug/m3 to undetectably low levels within two minutes, from which they concluded it could protect the vehicle occupant from biological attack⁶.
Grand claims need verifying, especially as to whether laboratory test results carry over into real-world conditions, so Emissions Analytics tested this model on a 2019 Tesla X in the UK. The test followed the protocol set out in an SAE paper published in 2019⁷.
The Tesla X is now equipped with a High-Efficiency Particulate Air (HEPA) filter as standard. In simple terms, the ventilation system has the typical ‘fresh air’ and ‘recirculation’ modes, but also the bioweapon mode too. This HEPA filter is enormous, as shown in the picture below – the installation requiring most of the width of the ‘frunk’. It is approximately 100cm long, 30cm tall and 3cm deep – a volume of over 9,000cm³. This compares to filter volumes on typical mass market cars of 1,000-2,000cm³.

The filter may be large, but it certainly works. In our test, interior concentrations were 94% lower than externally on fresh air mode, and 92% lower on the bioweapon mode during an on-road test – statistically indistinguishable from one another. This is the best performing vehicle we have tested so far. The principal difference between Tesla’s test and ours was that we measured ultrafine particles down to 15nm rather than particle mass. Together, the data suggests excellent protection from both bigger and smaller particles.
To put these results in context, Emissions Analytics tested 97 recent model year light-duty vehicles in the US in partnership with Edmunds⁸. Of all these, the best performing was a 2019 Honda Civic, which reduced particle concentration by 73%. Emphasising the significant differences, the worst performing vehicle was a 2019 Lexus ES, for which particles inside the vehicle were 254% higher than outside. Of the 97 vehicles, 44 had higher concentrations inside than out. This is an unregulated area at the moment, so there is no compliance issue, but there certainly is a potential health issue from chronic particle exposure.
A common driver strategy for protection from exterior pollution – often initiated when the driver senses a malodour – is to engage the recirculation mode on the ventilation system, which wholly or largely circulates, with varying degrees of filtration, existing interior air. This is effective in protecting from pollution ingress from outside, but has the side-effect of allowing CO² to build up in the cabin from the respiration of occupants. Although research is scarce in driving situations, the effects of elevated CO² on cognition have been shown, which leads to the reasonable belief that above 1,000ppm – compared to a background of just over 400ppm – there may be effects on driver safety as well as comfort⁹.
Returning to the Tesla, on fresh air mode, CO² increased by just 8%, while on recirculation the increase was 97%. Impressively, the bioweapon mode saw just a 17% increase. The average increase across the 97-vehicle test on recirculation mode was 15% on fresh air and 79% on recirculation.
From this, it is clear that there is a trade-off between protecting the vehicle occupant from particle ingress into the vehicle on fresh air mode and CO² build-up if recirculation is engaged. While this holds true at the level of the individual vehicle, it is not true at the market level. In other words, there are some models that are good at both, and some bad at both. The chart below plots each of the 97 models tested, plus the Tesla X, for particle infiltration on fresh air mode against CO² build-up on recirculation.

For particle number, the values are the ratio between concentrations in the interior and exterior air, so a value of one means they are the same on average. For CO², a value of zero means there is no increase in interior concentrations compared to the baseline. On this latter measure the Subaru Impreza showed the worst performance, in contrast with the best from the Chevrolet Suburban – as indicated on the chart.
In short, there is a wide diversity of results and no obvious pattern, whether it be by manufacturer, vehicle size or powertrain. The most conspicuous activity currently is from premium manufacturers, whose buyers perhaps have the greatest awareness or appreciation of clear cabin air. Beyond that, there appears to be little understanding of the issue in the absence of any useful consumer information.
To help address this, Emissions Analytics is actively involved in a group aiming to standardise the measurement methodology for in-cabin pollution¹⁰. The group was initiated by the AIR Alliance, which already publishes ratings for tailpipe pollution¹¹. Along with Emissions Analytics, the group includes a number of vehicle manufacturers, academics, and filter and ventilation suppliers. Once completed, recognised and repeatable testing should enable ratings to be published that will both inform car buyers and, indirectly, incentivise manufacturers to improve interior air quality.

The Covid-19 pandemic brings these issues to the fore, as the virus is a particle of approximately 100nm in size. While ingress of live virus particles from outside into the vehicle is unlikely, reducing the chance of one infected occupant transmitting the virus to another is more relevant. Therefore, the rate at which air is recirculated and re-filtered matters. In this context many initiatives have appeared from vehicle manufacturers, suppliers and after-market companies. One example has been trailed by Jaguar Land Rover, using hydroxyl radicals to ‘purify’ cabin air¹². While this may be true in terms of neutralising a coronavirus, surplus hydroxyl radicals can also react to form toxic secondary oxygenated gases and aerosols¹³, and so it is vital to perform a broader, perhaps untargeted, assessment of the effects of such systems. Systems should be compared to the efficiency of filter-based systems such as on the Tesla X, to judge what value the hydroxyl radicals are adding – a judgement that will be allowed once there is a standardised method through CEN Workshop 103.
Thus, perhaps the future market for vehicles will be one of the quality of the experience rather than the magnitude of the performance. BEV range anxiety may be quelled and the charge-up infrastructure made omnipresent. Cheap, renewable energy will make efficiency almost irrelevant. The gradual strangulation of the road space for cars, combined with connectively between vehicles and automation thereof, may leave occupants stripped of the joy of the driving experience, but consequently more demanding in terms of the quality and healthiness of the experience. And this differentiation in experience, comfort, quality and design may be the route to profitability for manufacturers.
Footnotes:
https://www.emissionsanalytics.com/news/2020/1/28/tyres-not-tailpipe
PM2.5, i.e. all particles up to a diameter of 2.5μm
https://www.tesla.com/en_GB/blog/putting-tesla-hepa-filter-and-bioweapon-defense-mode-to-the-test
DPham, L., Molden, N., Boyle, S., Johnson, K. et al., “Development of a Standard Testing Method for Vehicle Cabin Air Quality Index,” SAE Int. J. Commer. Veh. 12(2):2019, doi:10.4271/02-12-02-0012
Video: Testing Plug-In Hybrids and Battery Electric Vehicles
Following the success of our recent newsletter ‘Letting the cat out of the bag: The great plug-in hybrid subsidy’ our Founder and CEO, Nick Molden has showcased our thorough testing process.
Following the success of our recent newsletter ‘Letting the cat out of the bag: The great plug-in hybrid subsidy’ our Founder and CEO, Nick Molden has showcased our thorough testing process.
Our independent testing tests for electric range and fuel economy separately. This gives us the necessary resolution on the vehicles we test and provides invaluable insights into the economic impact of these vehicles too. Find out more about our process.
Watch our video to learn more:
Letting the cat out of the bag: The great plug-in hybrid subsidy
In a recent newsletter, we set out Schrödinger’s Car, drawing a parallel with the famous Schrödinger’s Cat thought experiment, where a cat in a box is both dead and alive until the box is opened.
In a recent newsletter, we set out Schrödinger’s Car, drawing a parallel with the famous Schrödinger’s Cat thought experiment, where a cat in a box is both dead and alive until the box is opened. Schrödinger’s Car is a vehicle that has high and low carbon dioxide (CO2) emissions until the occasion that it is driven, which describes the current situation with plug-in hybrid vehicles (PHEVs). In the best case, they could be cleaner than pure battery electric vehicles (BEVs), in the worst case higher emitting than standard internal combustion engines (ICEs), and on current behaviour no better than non-plug-in full hybrids (FHEVs) – all on a lifecycle analysis basis.
The conclusion was that PHEVs are too risky to allow into the market in any volumes, unless strong incentive mechanisms are put in place for drivers to charge them up regularly and employ them only on duty cycles that can be conducted mostly on battery. In some European countries, there are in fact positive incentives not to charge PHEVs, for example for company car drivers that get reimbursed for fuel spending but not additional domestic electricity consumption.
Emissions Analytics has tested 37 PHEVs in Europe and US using its standardised EQUA Index test protocol. The average CO2 emissions on the European PHEV vehicles tested are 115g/km, based on the typical proportion of miles driven on battery discussed below. This compares to an average on the official ratings of 58g/km, based on the Worldwide Harmonised Light Vehicle Test Procedure (WLTP) – so, real-world emissions are almost exactly double.

If these excessive CO2 emissions were not problematic enough in themselves, this situation is creating significant, but somewhat covert, subsidies of PHEVs in Europe and the UK through the fleet average CO2 target system and consumer incentives. As set out below, the annual subsidy across Europe may well be above €6bn already. However, this could rise steeply in a particular scenario that BEV take-up is slower than expected and manufacturers need to sell PHEVs in volume as they struggle to meet their ever-tightening fleet average CO2 targets through to 2030 and beyond. In contrast, if BEV penetration rises rapidly, the scenario set out below will not hold, as CO2 targets will easily be met, and PHEVs will be a brief transitional technology. In the more pessimistic scenario, where manufacturers rely heavily on PHEVs to meet CO2 targets, cumulative subsidy could add up to €475bn by 2035 – more than all motor-vehicle-related taxes paid each year in Europe1.
To illustrate this, a selection of three European PHEVs were taken, and each were paired with the nearest equivalent ICE vehicle. The official details are shown in the table below.

In a recent report, the International Council on Clean Transportation (ICCT) estimated the proportion of miles travelled on battery by PHEVs in Europe currently at around 37%2. This factor can be used to weight zero-CO2 battery operation with engine-only CO2 approximated by the WLTP of the equivalent ICE vehicle to yield a 'simulated' WLTP for the PHEV, as shown in the following table. This can be compared to the actual test values from the EQUA Index tests, weighted in the same way. Conversely, it is possible to estimate what proportion of driving would need to be on the battery for the NEDC and WLTP official test values to accord with actual practice.
Overall, EQUA Index CO2 results were only 4% higher than the simulated WLTP values. Whether considering the NEDC or WLTP, approximately 80% of driving must be on battery for the official CO2 values to be a meaningful representation of current driving, which is more than double the current reality.
This matters because of how it interacts with the Europe-wide fleet average CO2 targets. Averaging the emissions of new vehicles sold, each manufacturer must not exceed a threshold which is currently around 95g/km (the exact figure being tailored to each company, based on their mix of vehicle types), but which reduces over time. For each g/km above the limit, the manufacturer is fined £85 (€95) multiplied by the number of units sold. Below the limit, the manufacturer can effectively sell its surplus to a rival that is above the limit, thereby reducing the fine paid by that latter manufacturer by the same £85.
Taking the sample of three vehicles above, the simulated WLTP average is 114g/km compared to the official values of 35g/km, a difference of 79g/km. Alongside this, until 2022, the fleet average targets include ‘supercredits’, which allow each vehicle with official CO2 below 50g/km to count as 1.67 vehicles sold in the manufacturer’s overall fleet calculation. Therefore, the value of the difference in CO2 emissions is currently magnified, as shown in the table below.
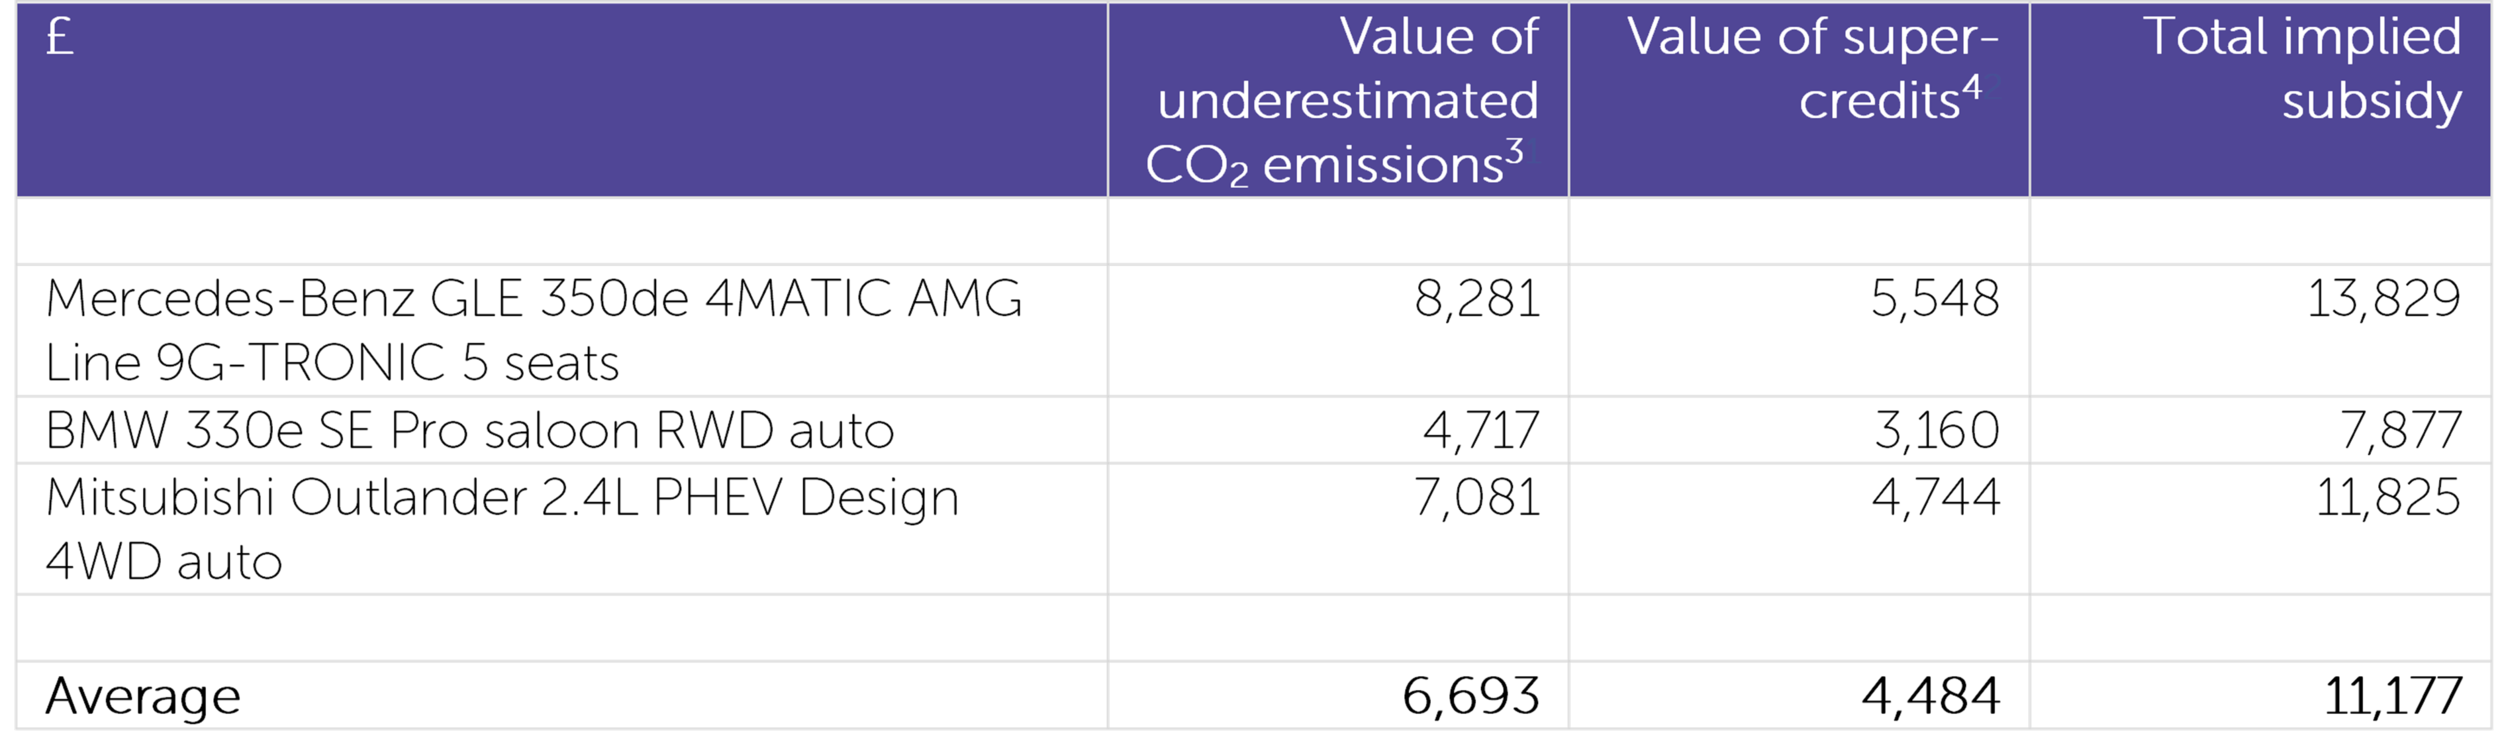
In other words, by having artificially low CO2 values, manufacturers enjoy a significant subsidy from the European taxpayer of over £11,000 (€12,100) per unit. This is equivalent to 24% of the list price. As these vehicles are typically profitable to make, unlike most pure battery electric vehicles, it is not surprising that a large number of new models are being brought to market.
In 2020, around half a million PHEVs were sold in Europe. This would imply a total subsidy of over £5.5bn (€6.1bn). Projections for PHEV sales in 2030 vary widely, from below 10% by Deloitte to as much as 50%. Assuming total sales of all powertrains of 15m vehicles in 2030, this implies a total potential subsidy in that year of between £10bn (€11bn) and £50bn (€55bn), factoring in the phase out of supercredits.
If we take the mid-point of these 2030 scenarios, PHEV market share grows in a linear way up until then, and is constant after that until 2035, the cumulative subsidy would be a not inconsiderable one-third of a trillion Euros. This is more than half the annual gross domestic product of Bavaria.
But this is does not cover all the subsidies available for PHEVs. Many European countries incentivise their purchase, through a combination of retail subsidies, annual car tax reduction and benefit-in-kind income tax reduction for cars provided to employees by their company. The type and magnitude of these subsidies vary significantly between countries, but we can take the UK as an example.
The source of the subsidy is the same as with the fleet average CO2 targets: artificially low official CO2 figures. It is the prerogative of governments to offer subsidies to consumers, but this is being done in a covert manner, and does not align with the true environmental effects of these vehicles. In the UK, the subsidy is channelled through company car benefit-in-kind tax and annual road duty. While the latter applies across the market, company cars – including schemes such as ‘salary sacrifice’ – account for only around 15% of the market5.
The table below shows the implied value of the underestimation of CO2 emissions – how much less consumers pay than they 'should'. The final column weights the company car subsidy by the 15% market share to get a representative value for the whole market.
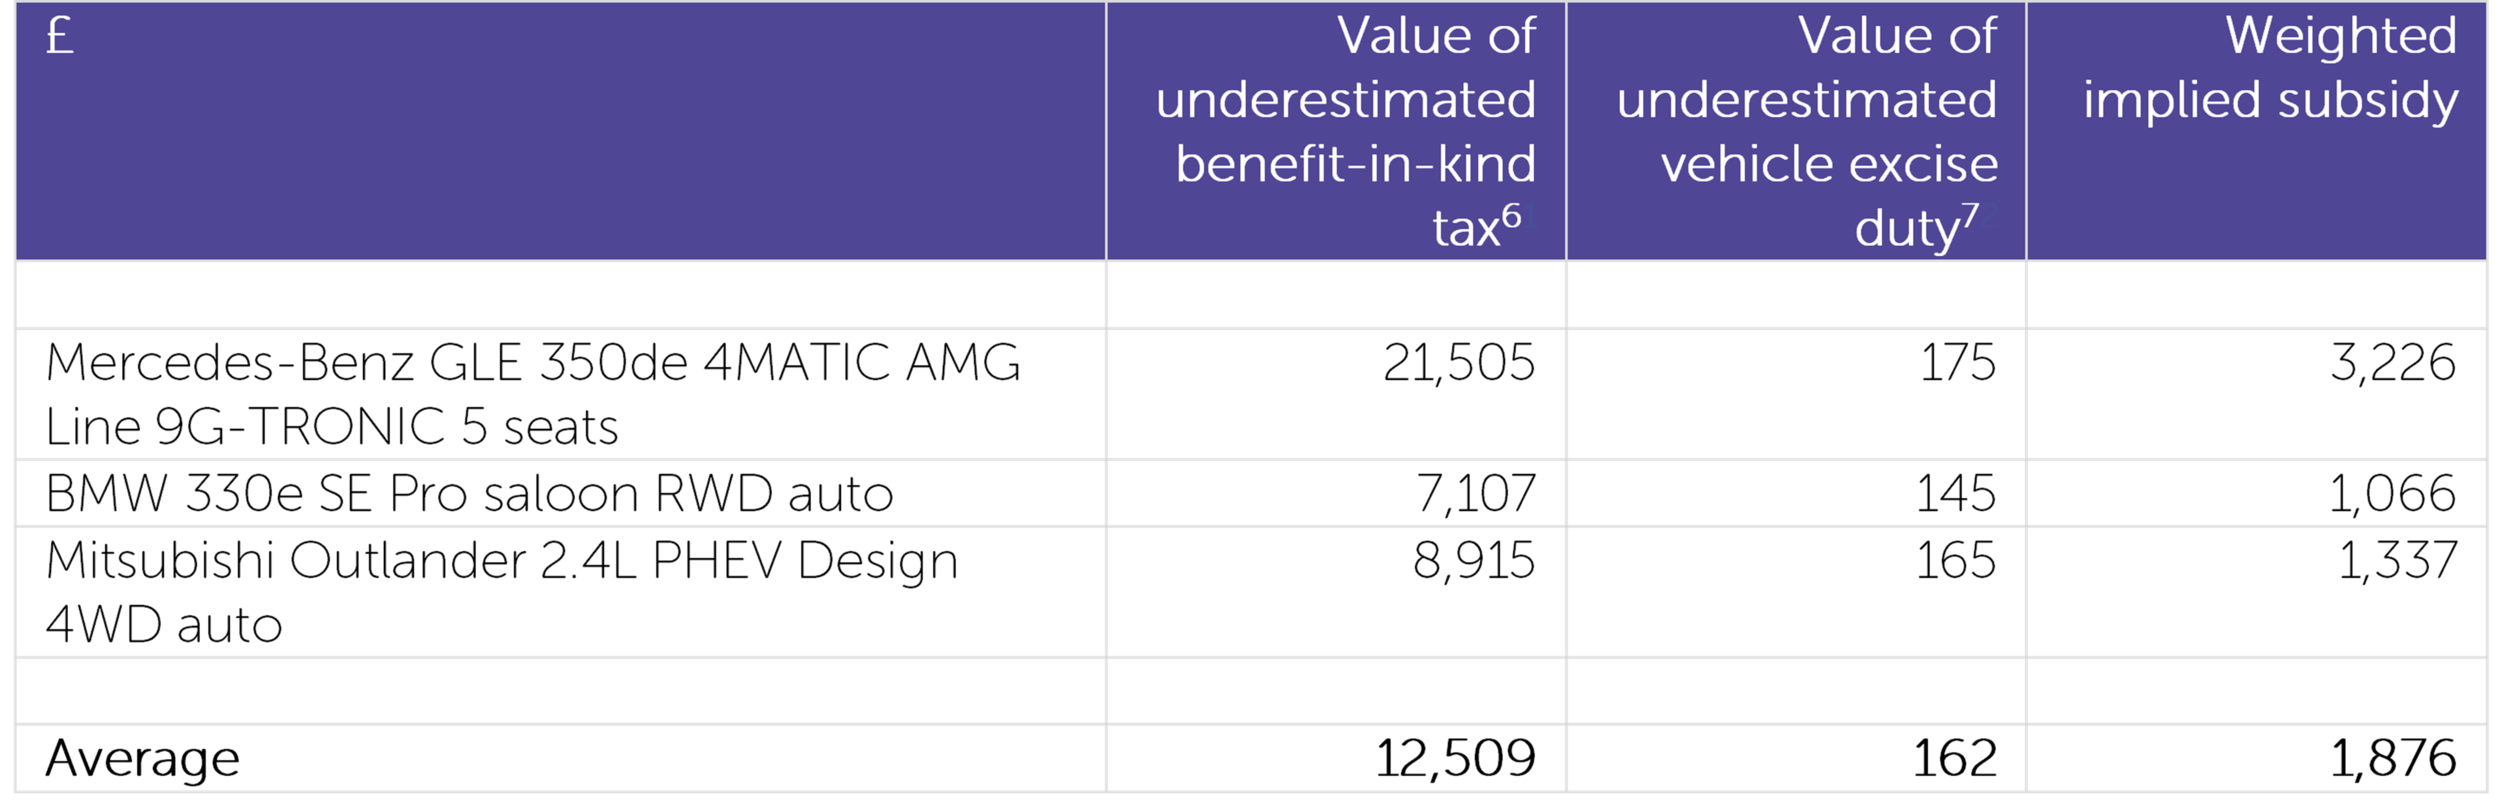
The subsidy to a company car driver over a three-year period is £12,671 (€13,938). On top of the manufacturer subsidy, this is 52% of the average vehicle list price. Across the whole UK market, weighting the company cars at 15% of the total market, the average consumer subsidy is over £1,800 (€1,980). Combining this with the manufacturer subsidy, the total subsidy is £13,053 (€14,358) per unit, or 28% of list price.
Taking this value, together with the same market share projections through to 2035 as above, the total subsidy would be €475bn – almost the same as the gross domestic product of Baden-Württemberg. Of course, this relies on the scenario that PHEVs are the swing factor for manufacturers in meeting or not meeting their future CO2 targets, which may not be the case if BEV penetration accelerates.
It should also be noted that the levels and terms of these taxes and duties are subject to change by governments at relatively short notice, and they differ between each country in Europe. Whether the overall level of support from governments is increased or decreased is unpredictable. In contrast, there is greater future visibility on the fleet average CO2 system.
Ultimately, the amount of taxpayers’ money dispensed, the trajectory of climate change and the structure of the automotive industry rides on whether Schrödinger’s Car, like the Cat, lives. Unless the right incentives are put in place around both original purchase for the right use cases, and after purchase to encourage charging the vehicles, PHEVs should have all subsidy removed immediately. With the current propensity for owners to charge their PHEVs, the CO2 emissions are no better than traditional hybrids, which do not attract the same subsidies, and which put much less pressure on the battery material supply chain.
Footnotes:
ACEA (European Automobile Manufacturers’ Association), https://www.acea.be/press-releases/article/motor-vehicle-taxation-brings-in-440.4-billion-for-governments-in-major-eur
Real-world usage of plug-in hybrid electric vehicles, International Council on Clean Transportation/Fraunhofer Institute for Systems and Innovation Research ISI, September 2020
Difference between simulated CO2 and NEDC, multiplied by £85 (€95) as the market price of carbon, applied only in year of purchase
Supercredits as defined under fleet average CO2 system – assuming x1.67 for a sale in 2021
According to HMRC, there are 870,000 company car drivers in total (https://www.fleetnews.co.uk/news/fleet-industry-news/2020/09/30/hmrc-data-shows-30-000-fewer-company-cars) and a vehicle may be held for an average of three years, yielding 290,000 purchases per year, which is approximately 15% of the 2m annual UK car market
Assuming 40% higher-rate tax payer, multiplied by 10% company car share of market over three-year period and 13.8% employer National Insurance
Annual vehicle road tax, based on CO2 emissions over three years

Schrödinger’s Car
Are they good or are they bad? Like the feline thought experiment, where the cat is both dead and alive simultaneously until observed, the answer is that plug-in hybrid vehicles (PHEVs) are both good and bad until they are used.
Resolving the enigma of plug-in hybrid vehicles
Are they good or are they bad? Like the feline thought experiment, where the cat is both dead and alive simultaneously until observed, the answer is that plug-in hybrid vehicles (PHEVs) are both good and bad until they are used. It matters because this particular powertrain lies at the epicentre of the battleground for carbon dioxide (CO2) reduction and, therefore, the prospects for containing climate change.
An earlier newsletter (Plugin hybrids without behavioral compliance risk failure) considered the variability in emissions and fuel consumption of PHEVs, and the dangers for policy. Now that PHEV sales are accelerating, the topic has become more urgent: how to ensure that a valid bridging technology to an electrified future does not become the next emissions crisis. How can we head off a collision between unpredictable consumer behaviour and misleading official emissions ratings?
Car labelling (whether for CO2, fuel economy or noxious emissions) has historically been about the car, with the view that ultimately its performance can be characterised fairly in a single “combined” number. This figure is used variously for regulation, taxation, urban access policy and consumer information. Now we face the situation where vehicle performance is arguably secondary to driver behaviour. The corollary of this is, perhaps: label the driver, not the car.
In traditional vehicle emissions labelling, it has been possible to “get away” with the single combined number because the difference between the worse case (urban driving) and better case (motorway driving) was around a one-third increase in CO2 emissions and fuel consumption. In other words, the combined number would not be far away from reality for most drivers over time.
Emissions Analytics has tested 37 PHEVs for its independent emissions programme. The method uses the EQUA Index test route – which is significantly longer than official cycles, combining urban, rural and motorway driving – and tests separately for electric-only range and engine-only efficiency, both in real-world, on-road conditions.
The table below summarises the results, split between European and US tests1. Comparing the engine-only mode to official certification values, real-world CO2 emissions are between double and treble. In this case, though, the real-world combined number appears to be a good characterisation of the performance of the vehicle, whether it is used in urban or extra-urban driving.

However, once you introduce real-world driver behaviour in terms of trip mixes and charging up of the battery between trips, it becomes clear that there is a significant problem. From the same test data, real-world CO2 emissions are as high as 299g/km in average urban driving if you never charge the battery up. At the other extreme, if you always charge up the battery and only ever take short journeys, CO2 emissions will be almost zero. In other words, there are orders of magnitude of difference between the best and worse cases. In certain use cases, real-world CO2 may be substantially better than the official figures.
For comparison, at the height of the divergence between the old New European Driving Cycle (NEDC) and real-world values for internal combustion engines (ICEs) – before it was replaced by the Worldwide Harmonised Light Vehicle Test Procedure (WLTP) – the spread was only around 50%. The result of the NEDC official labelling system diverging from reality artificially led to the sales of downsized engines in large cars and the dieselisation of city cars. The damage in terms of both CO2 emissions and air quality will remain for more than another decade as those ‘artefact vehicles’ remain on the fleet.
The US test procedure is different from the WLTP, but achieves similar test results, but then applies a reduction of up to 30% to the fuel economy values and thereby a similar increase to the CO2 values. While this approach can work well for ICEs to align official values for real-world consumer labelling, it does not solve the problem of the divergence in performance possible for each PHEV.
The variance in performance between best and worst cases is more than a point of statistical interest. It has the strong potential to undermine the whole system of fleet average CO2 targets. If, for example, these vehicles travel only 10% of their distance on battery, they would be greater generators of CO2 emissions that full hybrids (FHEV) and mildly hybridised diesel ICE vehicles.
This proportion of miles travelled on the battery is called the “utility factor” (UF). If we compare the average European real-world tailpipe emissions of 182g/km from a PHEV with the crucial 50g/km threshold, this implies a UF of 72%. The 50g/km is important because it is a widely recognised benchmark for “ultra low emission vehicles”, below which manufacturers receive supercredits towards their fleet average CO2 targets and many consumers receive significant tax benefits. However, according to a recent report from the International Council on Clean Transportation (ICCT)3, the UF may currently be around 37% – this would imply real-world CO2 emissions of around 115g/km, worse than the best FHEVs.
On this 37% UF scenario, real-world emissions would be 130% higher than the 50g/km threshold. This means that labelling of PHEVs presents a much greater danger than ICEs did under the NEDC, the latter being a major contributor to the Dieselgate scandal. The combination of low CO2 values the WLTP permits and the current supercredits system is leading manufacturers to launch a large number of new PHEV models. For example, Jaguar Land Rover will have seven models by the end of 2020, and Daimler will have 20 by 2021, rising to 25 by 2025. In the UK, sales of PHEVs rose from 4,788 in January 2020 to 12,400 by September. According to the Fraunhofer Institute, there were approximately two million such vehicles on the roads worldwide by the end of 2019. Therefore, the next scandal is already brewing, as manufacturers react to the incentive structure provided by regulations, which is creating the next generation of artefact vehicles.
The system as currently constructed means that the manufacturer is bearing no direct risk of this UF being less than required for real-world emissions to align with official values. Instead, society bears the risk. In fact, manufacturers have a positive incentive to produce these vehicles due to the supercredits system that runs for the coming three years. This is a dysfunctional situation.
To illustrate the degree of the challenge, we can consider what proportion of miles must be driven on battery by a PHEV to be better than alternative powertrains. To make the comparison as fair as possible, including against BEVs, lifecycle emissions are used in the table below.

These values are based on Emissions Analytics’ testing of Euro 6 vehicles, and its proprietary lifecycle model. ‘Cleaning grid’ refers to the CO2 intensity of the electricity used to power a new BEV over its lifetime as the grid decarbonises, as forecast by the Eindhoven University of Technology5.
Although even modest charging-up renders PHEVs superior to unhybridised ICEs, a mildly hybridised diesel – with a ~6% efficiency advantage over a standard diesel ICE – would be comparable if around a fifth of miles were on the battery. The current utility factor of 37% described above leaves PHEVs performing the same as non-plug-in full hybrids, but with the extra consumer hassle and resource requirements. However, PHEVs can be superior to BEVs if they are used on the battery for just over seven out of every ten miles, using a reasonably optimistic view on grid decarbonisation, due to the extra CO2 from manufacture of the larger BEV battery.
The final line in the table shows that the official 50g/km threshold implicitly assumes that consumers charge up at least 73% of the time, which is double the reality. This is another way of quantifying the artefact of the WLTP and fleet average CO2 target systems.
This shows that it is possible to argue that PHEVs are the best of all worlds, rendering all other powertrains obsolete. Customers could have the smooth, low-end torque, high-end power boost and no range anxiety at an acceptable price. At the same time, you could argue that they are no better than non-plug-in hybrids and should not exist. Thence this enigmatic feline?
One option would be for manufacturers to assume this UF risk, through a system of post hoc reweighting of their official figures for the purposes of the fleet average CO2 targets, according to the real-world UF. Consumer labels could also be reviewed annually, without vehicles needing to be retested or certified. This would incentivise manufacturers to market these vehicles only to consumers likely to operate them with a high UF.
Under European regulations, vehicles will have to report their real-world fuel consumption from 2021. This could give a good estimate of the real-world UF, which could be used for this reweighting, applied retrospectively to all PHEVs on the road. It would not be a sufficient solution just to wait and see from this data whether there is a problem. There is a problem, and this data can be used to implement a solution today. In vehicle and product safely law, manufacturers are generally responsible for the foreseeable misuse of their products – not charging up a PHEV is arguably foreseeable misuse.
Putting risk onto the manufacturer could be coupled with more sophisticated charging mechanisms for consumers. In the UK, the Renewable Heat Incentive (RHI) for domestic heating offers a subsidy to homeowners based on the amount of ‘renewable’ heating generated, e.g. from an air-source heat pump. Translating this onto vehicles, a telematics system could provide a subsidy for every mile driven on battery and tax on every minute the engine is running. Through a solution like this, the risk could be shared between the manufacturer and the car owner, while delivering society’s goal.

Unless this challenge is resolved, it could lead to – if PHEVs gain high market share – a subversion of the policy for reducing CO2, but equally – if PHEVs are banned – the removal of a potentially powerful low-carbon technology. If you already believe the endgame is BEVs and we just need to get there as soon as possible, then banning PHEVs will seem the obvious and comfortable option. If you believe that the world’s light duty fleet should not be controlled by an oligopoly through its access to battery raw materials and that a competitive market of rival powertrains should be fostered, then the PHEV conundrum needs to be solved.
There are ways in which the official testing regime could be improved. For example, the EQUA Index test methodology for PHEVs developed back in 2014 acknowledged these vehicles could not be characterised in a single number. Therefore, each vehicle has both an electric-only range and an engine-only fuel economy. The official system in the EU already has similarly granular information from certification tests, but then falls into the trap of producing a single number. More recently, Emissions Analytics has measured electricity consumption independently of the vehicle’s systems in real-world conditions through a portable meter, coupled with a measurement of charging losses. Overall, this is the most condensed yet representative way of labelling this type of powertrain.
Nevertheless, better labelling does not answer the policy question of how these vehicles should be represented in the fleet CO2 targets, which still comes back to actual consumer behaviour and that utility factor. Get it wrong, and we may miss our CO2 targets by a significant margin, or dispose of an attractive technology. We may, through neglect, cede a major global market to the owners of certain strategic raw materials.
In the European Commission’s own words: “The stakes are high.”6
Footnotes:
- It is worth noting that the products are clearly very similar in performance between the two territories, and also in technology, as average engine size is 2.0 litres and average battery capacity 11.5 kWh in both regions. The average electric-only range across both markets is 41km. Average prices in Europe are around £41,000 compared to typical average ICE vehicles at £25,000-30,000.
- CO2 conversion from the US Environmental Protection Agency’s MPG-equivalent value
- Real-world usage of plug-in hybrid electric vehicles, International Council on Clean Transportation/Fraunhofer Institute for Systems and Innovation Research ISI, September 2020
- Applying estimated manufacture CO2 emissions to tailpipe threshold for supercredits
- Comparing the lifetime green house gas emissions of electric cars with the emissions of cars using gasoline or diesel, Eindhoven University of Technology, 2020
- Critical Raw Material Resilience: Charting a Path towards greater Security and Sustainability, European Commission, COM(2020) 474 final, 3 September 2020
Archive
- AIR Alliance 3
- Air Quality 38
- Audio 3
- Climate Change 14
- EQUA Index 21
- Electrified Vehicles 28
- Euro 7 3
- Fuel Consumption/Economy 20
- Fuels 4
- Infographic 18
- Media 4
- NRMM/Off-road 3
- Newsletter 103
- Podcast 7
- Presentation/Webinar 18
- Press Release 19
- Regulation 16
- Reports 4
- Tailpipe Emissions 49
- Tyre Consortium 2
- Tyre Emissions 26
- Vehicle Interior 6